Abstract
The health state of a structural beam as a flexural member can be evaluated by the curvature or flexural strain. Measured strain data provide more accurate flexural characteristics than the curvature approximation by the central difference method from the displacement mode shape and DFRFs (displacement frequency response functions). The strain sensor may be sensitive to local damage when analyzing the flexural response. This work presents a method to detect damage utilizing only the measured strain data collected from a damage-expected beam structure without intact baseline data. The static method from the measurement strain data and the dynamic method from measured SFRFs (strain frequency response functions) are introduced. It can be observed that damage exists in the region, which represents an abrupt change in the strain response. The validity of the method is illustrated by numerical and experimental applications.
1. Introduction
Structural damage detection methods are used to collect information about parameters that are related to the structural performance, including displacements, strains and stresses. Most damage detection methods require knowledge of the fundamental information of a structure without damage to establish a baseline for damage detection. However, these methods are not very suitable for practical structures for which baseline data cannot be readily obtained. Practically, the structural performance should be evaluated by only the measured data in the damaged state.
The localized loss of the stiffness in a structural beam produces a local increase of the curvature at the location. The health state of a structural beam as a flexural member can be evaluated by the curvature or flexural strain. The flexural strain is an index to evaluate the flexural deformation of structural members and is related to the flexural curvature. The local high flexural strain indicates the existence of damage due to the deterioration of the flexural capacity.
The mode shapes and frequency response function (FRF) responses to be experimentally measured are converted to the modal and FRF curvatures, respectively, using the central difference approximation. The estimated curvatures should be widely utilized in detecting damage. The measured strains can be used more accurately than the approximated curvatures.
Doebling et al. [1] introduced various vibration-based damage identification methods. Existing identification methods can be classified into the dynamic identification method, which uses dynamic test data, and the static identification method, which uses static test data. Unlike the requirement of the mass, damping and stiffness properties in the dynamic method, the static approach only needs the stiffness property and can be more economical and more accurate than dynamic testing. Sanayei and Onipede [2] provided an analytical method to identify the properties of the structural elements from static test data. Cui et al. [3] developed a damage detection algorithm based on the static displacement and strain. Adewuyi et al. [4] claimed that damage detection techniques based on distributed strain approaches are a more efficient choice than traditional vibration approaches when using noisy measurements. Serker and Wu [5] derived a damage identification method for damage localization and quantification based on noise-free distributed static strain data. They [6] presented a structural health monitoring (SHM) strategy that is applicable to bridges based on continuous strain (static and dynamic) data obtained by a distributed long-gage fiber. Starting from the derivation of an analytical method to expand the measured static displacement data to full degrees of freedom, Lee et al. [7] proposed a damage detection method to detect the damage of a damaged beam by introducing the displacement curvature and damage factor. Pandey et al. [8] detected the location of cracks by observing changes in the curvature mode shapes from the displacement mode shapes. Wahab and Roeck [9] considered the application of the change in the modal curvatures to detect damage in a prestressed concrete bridge and presented some important conclusions concerning the computation of the modal curvatures.
FRF data provide more information than modal data because the latter are extracted from a very limited frequency range related to the resonance. The FRF is more effective than the modes because experimental FRFs are directly obtained in the experiments. Sampaio et al. [10] expanded the DFRF (displacement frequency response function) curvature method to the SFRF curvature method based on the difference in the SFRF curvature between the intact and damaged states. Mingyao et al. [11] presented a damage detection method utilizing FBG (fiber Bragg grating) distributed strain data and the SFRF index, which is expressed as a function of the difference in the SFRF between the intact and damaged states. Esfandiari et al. [12] provided a finite element model updating method of SFRFs and utilized a sensitivity-based criterion for the selection of frequency ranges for robust optimization. Based on distributed long-gage fiber optic sensors, Wu and Li [13] presented a damage detection method of a two-level strategy using the modal parameters extracted from dynamic macro-strain responses. Katsikeros and Labeas [14] considered the effect of strain measurements dependent on the crack location and provided a strain-based structural health monitoring system. Using four FBG optical sensors, Loutas et al. [15] presented an intelligent system for structural health monitoring to identify the structural state condition based on dynamic strain measurements. Li et al. [16] gave a structural health monitoring method for the detection of debonding in composite bonded patches based on the relative strain measurements of external doubler repair and scarf repair. Li et al. [17] performed a strain modal analysis of a damaged plate based on the continuity condition and the residual strain mode shape. Lee et al. [18] presented the global difference method to detect damage using FRF measurement data without baseline data.
The local change in the flexural response after the occurrence of damage comes from the local deterioration of the flexural rigidity. This work presents a method to detect damage utilizing only the strain data collected from a damage-expected beam structure without intact baseline data. It is expected that the strain response displays sensitive change in the neighborhood of the damage region. This is the starting point for detecting damage in this proposed method. The validity of the proposed method is illustrated in numerical and experimental works.
2. Basic formulation for static strain-based damage detection
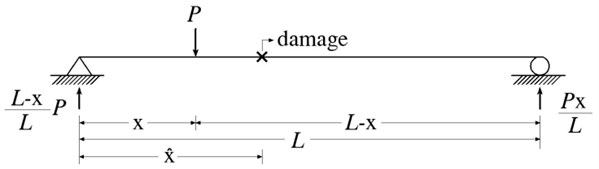
Consider a simply supported beam subjected to a concentrated load at the distance from the left end support, as shown in Fig. 1. The beam has a span length of and a gross cross-section of . The damage is located at , and the load is at . The strain at the loading point , can be written by:
where denotes the moment at the loading point , the elastic modulus and the section modulus of . The height of the undamaged and damaged sections is and , respectively, and the corresponding section moduli are replaced by and , respectively.
Fig. 1Static-based damage detection of damaged beam subjected to P
Inserting the moment at into Eqn. (1) and arranging the result, the damaged section modulus is derived as:
where . Equation (2) shows that the damaged section modulus depends on the loading point and the section modulus at its position. The abrupt change in the flexural strain is displayed in the neighborhood of the damage region because of the local loss of section, as shown in Eqn. (2). The strain can be explicitly utilized to evaluate the health state without any approximate process.
3. Numerical example
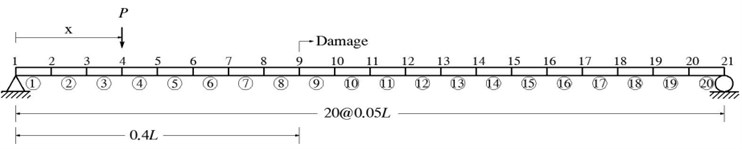
Consider a simply supported beam subjected to a concentrated load at location , as shown in Fig. 2. The gross cross-section is 300 mm×500 mm and the damaged cross-section is 300 mm×480 mm. The simple beam of a span length was modeled as 20 beam elements, and the length of each element was 0.05. A single damage of 4 % height loss was positioned at 0.4 from the left end. The measurement location coincided with the loading point. The loading and measurement points were simultaneously moved in order of the node number, starting from node 2. It was assumed that the flexural strain of the beam was measured at the bottom of the cross section of all nodes. The measured strains were collected, and the damage was detected by investigating them.
Fig. 2Finite element modeling of a simply supported beam
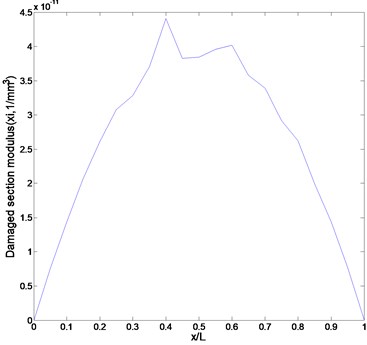
We utilized the numerically simulated data to be determined by Eqns. (1) and (2) as the measurement strain data. The data were assumed to be contaminated by 5 % external noise. Figure 3 represents the measured strain data to describe the flexural static behavior. If the damage doesn’t exist in the beam, the strain along the beam can be described by a smooth curve. The existence of the damage leads to the abrupt strain change in the neighborhood of the damage. The strain curve in Fig. 3 provides enough information for damage detection. The abrupt change in the measured strain is observed in the neighborhood of , which is the prescribed damage location. It is certified that the strain data measured by strain gages can be utilized to evaluate the damage location without converting the displacement data measured by accelerometers. However, if the measurement point does not coincide with the damage location, the damage cannot analytically be detected by Eqn. (2), and only the strain data can be measured. The strain gage is suitable for detecting local damage. However, considering that stiffness deterioration due to damage affects the responses of the adjacent elements, the validity of the damage detection method utilizing strain gages shall be investigated by experimental work.
Fig. 3Numerically simulated strain curve
4. Experimental verification
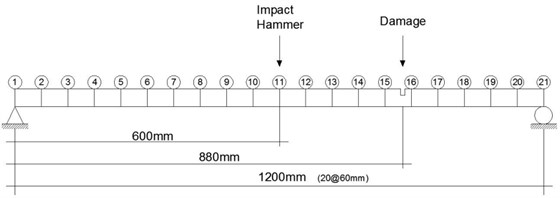
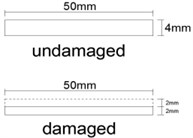
An experiment of a simple beam under the loading arrangement shown in Fig. 4 was carried out to evaluate the applicability of the damage detection method using strain gages. The beam is 1200 mm in length, and its gross cross-section is 50 mm×4 mm. The damage is located at 880 mm from the left end, and its cross-section is 50 mm×2 mm. Nineteen loading points and strain gages were positioned at intervals of 60 mm. Two strain data sets at nineteen loading points were collected under two loading sets of 0.38 kg and 0.48 kg. Two data sets corresponding to nineteen loading points were collected by moving the loading points. The strain was measured using a TML strain gage of type FLA-5-11, and data were collected by the system TDS 303.
Fig. 4A damaged beam for experimental work
(a)
(b)
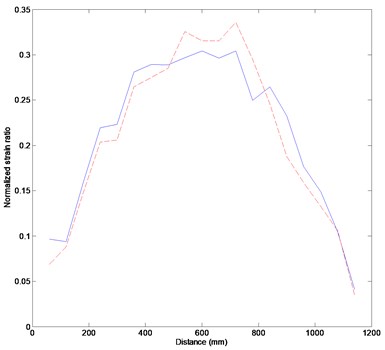
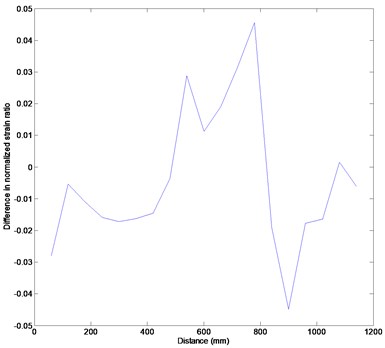
Figure 5(a) represents the strain data corresponding to two different loading cases. The solid line represents the strain data under a loading of 0.38 kg, and the damage located in the region of 780 mm displays its abrupt change. However, the damage can hardly be detected by the dashed line, which represents the strain data under a loading of 0.48 kg. These results cannot guarantee that the measurement data using only strain gages provide enough information on the damage. Expecting that the strain response depends on the load magnitude, we considered the difference between different strain data sets corresponding to the load magnitudes. Figure 5(b) shows the difference in the strain data at both states, and there is an abrupt change between 780 mm and 840 mm in the neighborhood of the damage. The experimental results reveal that damage can be detected by investigating the measured strain data under the concentrated load as well as the difference between the data. It is verified that damage can be detected even though the damage does not coincide with the sensor location because, unlike in the analytical approach, the stiffness deterioration due to the damage is transferred to the adjacent elements. The beam test shows that the static strain-based damage identification approach can be easily utilized without any information on the intact structure and the approximate process.
Fig. 5Experimental results: (a) measured strains, (b) strain difference between the loadings of 0.38 kg and 0.48 kg. The solid and dashed lines indicate the strains under the loadings of 0.38 kg and 0.48 kg, respectively
(a)
(b)
5. Formulation for dynamic strain-based damage detection
The SFRFs should be utilized for evaluating the structural health state using strain gages. The dynamic behavior of a structure, which is assumed to be linear and approximately discretized for DOFs, can be described by the equations of motion:
where , , and denote the analytical mass, stiffness, and damping matrices, and . is an load excitation vector.
Substituting into Eqn. (3), premultiplying the result by and normalizing the mode shapes to the unit modal mass ( 1, 2,…, ) it follows that:
where , , (),
Inserting and into Eqn. (4) and expressing it in the frequency domain, it follows that:
where denotes the excitation frequency and .
Modal transformation using the real eigenvalues and eigenvectors leads to the representation of the FRF matrix for an excitation frequency :
with and . is the transformation matrix, and is the modal displacement vector. Substituting the modal strain vector into Eqn. (7), where indicates the coefficient matrix to relate the vector of all nodal displacements and the vector of all nodal strains, the SFRF describing the single output due to a single dynamic input can be written as:
where represents the th strain mode shape.
where denotes the th strain mode shape at response measurement position .
The SFRF data, () measured by strain gages at the excitation positions were collected. To obtain other measurement data, we attached a small mass at the measurement point to be regarded as the stiffness deterioration. Its results were similar to the results of the action of additional loading at the measurement point, and damage can be observed by the abrupt change in the response in the damage region. The SFRFs and their difference, which depends on the mass attachment, will be utilized for damage detection like the static approach.
6. Experimental verification
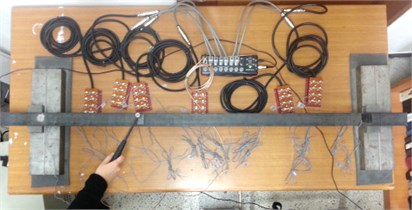
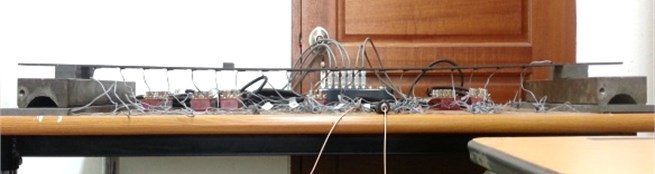
The same beam as the static test beam in Fig. 4 was utilized for the verification of the proposed dynamic strain-based damage detection method. The experimental setup for the beam test was shown in Fig. 6. The strain measurement was conducted using a TML strain gage of type FLA-5-11 along with a miniature transducer hammer, Brüel & Kjaer model 8204, for the excitation of the system. The data acquisition system was a DEWETRON model DEWE-43. The SFRFs were measured at each frequency. SFRFs relative to the reference location of the stationary strain gage are measured. The measured data are collected as SFRF which is defined as the ratio of the strain mode of a system to its excitation force. The SFRF response data can be experimentally obtained by the roving of impact hammer.
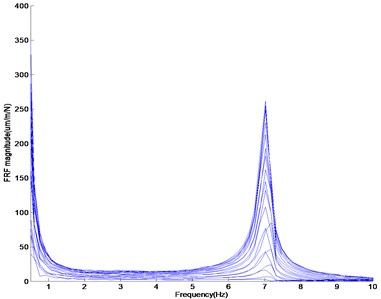
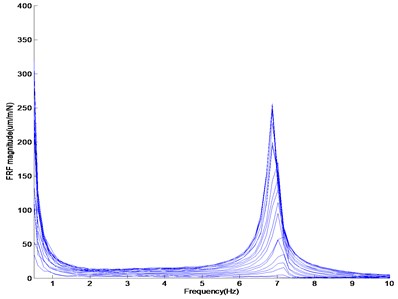
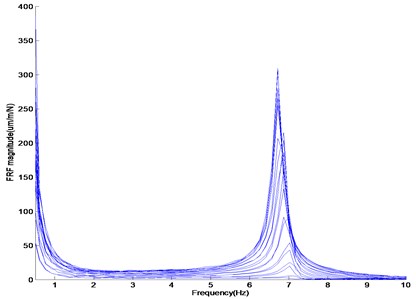
The damage is located at 880 mm from the left support between the impact nodes 14 and 15. The SFRFs measured by the unit impulse at the impact location are obtained, and this data collection process is repeated by moving the impact location. The resulting measurement data are utilized as the data set (). Two more data sets are obtained by attaching two different masses of 60 g and 82.5 g. These data are taken because mass addition leads to a more abrupt change in the dynamic response near the damage region rather than at other positions. By attaching the mass and measuring the FRF at the impact location, the additional data set is collected. Figure 7 shows the plots of the SFRF amplitude versus the frequency to be obtained from the beam test without and with mass addition. The first resonance frequency on the beam without mass addition changes very slightly and is in the range of 7.019-7.172 Hz according to the movement of the impact location. The first resonance frequencies on the beam with mass additions of 60 g and 82.5 g are in the range of 6.866-7.019 Hz and 6.714-6.866 Hz, respectively. Such inconsistency comes from the mass addition and impact locations.
Fig. 6Experimental set up
(a)
(b)
Fig. 7SFRF amplitude according to frequency: (a) SFRF amplitude of the beam without mass addition, (b) SFRF amplitude of the beam without mass addition of 60 g, (c) SFRF amplitude of the beam without mass addition of 82.5 g
(a)
(b)
(c)
The damage location was investigated by taking the measured SFRFs in the frequency range of 6.561-7.172 Hz, including the first resonance frequencies of three cases, extracting the POD (proper orthogonal decomposition) from them, and comparing the POM (proper orthogonal mode) corresponding to the first POV (proper orthogonal value).
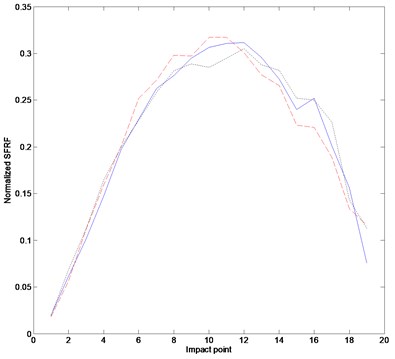
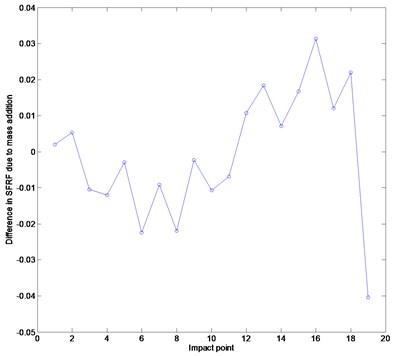
Figure 8(a) represents the POM curves corresponding to the first POV depending on the mass addition. The three curves display the abrupt POM change in the neighborhood of node 15 of the prescribed damage. Figure 8(b) represents the POM difference between the tests without mass addition and the tests with a mass addition of 60 g. The plot shows that the damage is located around node 16. From these experimental results, the dynamic method using strain gages can be easily utilized in detecting damage without any intact information.
Fig. 8POM curves of the beam: (a) POM curves, (b) difference in POMs between without mass addition and with mass addition of 60 g. The solid, dashed and dotted lines indicate FRF curves without mass addition and with mass addition of 60 g and 82.5 g, respectively
(a)
(b)
7. Conclusions
This study provided a damage detection method to determine the location of damage using only the static or dynamic strain data without intact information on the damaged system. The damage was investigated by the measurement strain data set from a damaged system depending on the load magnitude and mass addition. It was observed that damage was detected by evaluating the strain curve as well as the difference between two strain data. The method does not require the baseline data from the intact structure and can detect damage using only the measured strain data. The method and its practical applications were verified in numerical and experimental works.
References
-
Doebling S. W., Farrar C. R., Prime M. B., Shevitz D. W. Damage Identification and Health Monitoring of Structural and Mechanical Systems from Changes in Their Vibration Characteristics: a Literature Review. Los Alamos National Laboratory, 1996.
-
Sanayei M., Onipede O. Damage assessment of structures using static test data. AIAA Journal, Vol. 29, 1991, p. 1174-1179.
-
Cui F., Yuan W. C., Shi. J. J. Damage detection of structures based on static response. Journal of Tongji University, Vol. 281, 2000, p. 5-8.
-
Adewuyi A. P., Wu Z., Serker N. H. M. K. Assessment of vibration-based damage identification methods using displacement and distributed strain measurements. Structural Health Monitoring, Vol. 8, 2009, p. 443-461.
-
Serker N. H. M. K., Wu Z. A non-baseline damage identification method based on the static strain response. Proceeding of the International Conference on Mechanical Engineering, 2007, p. 29-31.
-
Serker N. H. M. K., Wu Z. Structural health monitoring using static and dynamic strain data from long-gage distributed FBG sensor. IABSE-JSCE Joint Conference on Advances in Bridge Engineering-II, 2010.
-
Lee E. T., Lee M. S., Bae C. Y., Eun H. C. A study on performance assessment of damaged beam based on static approach. International Journal of Modern Physics B, Vol. 22, 2008, DOI: 10.1142/S0217979208047468.
-
Pandey A. K., Biswas M., Samman M. M. Damage detection from changes in curvature mode shapes. Journal of Sound and Vibration, Vol. 145, 1991, p. 321-332.
-
Wahab M. M. A., De Roeck G. Damage detection in bridges using modal curvatures: applications to a real damage scenario. Journal of Sound and Vibration, Vol. 336, 1999, p. 217-235.
-
Sampaio R. P. C., Maia M. M. M., Silva J. M. M. Damage detection using the frequency response function curvature method. Journal of Sound and Vibration, Vol. 226, 1999, p. 1029-1042.
-
Mingyao L., Menglong K., Zude Z., Yuegang T. Strain response frequency function-based mechanical damage identification by fiber bragg grating sensors. Second International Conference on Digital Manufacturing and Automation, 2011.
-
Esfandiari A., Sanayei M., Bakhtiari-Nejad F., Rahai A. Finite element model updating using frequency response function of incomplete strain data. AIAA Journal, Vol. 48, 2010, p. 1420-1433.
-
Wu Z., Li S. Two-level damage detection strategy based on modal parameters from distributed dynamic macro-strain measurements. Journal of Intelligent Material Systems and Structures, Vol. 18, 2007, p. 667-676.
-
Katsikeros Ch. E., Labeas G. N. Development and validation of a strain-based structural health monitoring system. Mechanical Systems and Signal Processing, Vol. 23, 2009, p. 372-383.
-
Loutas T. H., Panopoulou A., Roulias D., Kostopoulos V. Intelligent health monitoring of aerospace composite structures based on dynamic strain measurements. Expert Systems with Applications, Vol. 39, 2012, p. 8412-8422.
-
Li H. C. H., Beck F., Dupouy O., Herszberg I., Stoddart P. R., Davis C. E., Mouritz A. P. Strain-based health assessment of bonded composite repairs. Composite Structures, Vol. 76, 2006, p. 234-242.
-
Li L. L., Cheng L., Yam L. H., Wong W. O. Identification of damage locations for plate-like structures using damage sensitive indices: strain modal approach. Computers & Structures, Vol. 80, 2002, p. 1881-1894.
-
Lee E. T., Rahmatalla S., Eun H. C. Non-baseline damage detection based on the deviation of displacement mode shape data. Journal of Nondestructive Evaluation, Vol. 32, 2013, p. 14-24.
About this article
This work was supported by the National Research Foundation of Korea (NRF) Grant funded by the Korea Government (MEST) (No. 2011-0012164).
