Abstract
Gears are one of the most widely used elements in rotary machines for transmitting power and torque. The system is subjected to variable speed and torque which leads to faults in gears. This paper presents two different online condition monitoring systems using fuzzy and artificial neural network (ANN) controller for the fault diagnosis of spur gear. This work is conceived as pattern recognition problem and it consists of four main phases: viz. feature extraction, feature selection using C4.5 algorithm, training of fuzzy and ANN controllers with the selected features. Under feature extraction, statistical features like skewness, standard deviation, variance, root mean square (RMS) value, kurtosis, range, minimum value, maximum value, sum, median and crest factor are considered as features of the signal in the fault diagnostics. These features are extracted from vibration signals of time domain obtained from the experimental setup through a piezoelectric sensor. The vibration signals from the sensor are captured for normal tooth, wear tooth, broken tooth and broken tooth under loading conditions. The controllers are built and tested with representative data and the performance is also discussed.
1. Introduction
A gear is a machine element designed to transmit power and motion from one mechanical unit to another. Gears are important components in many industries and transport applications. Condition monitoring of such machines is gaining importance in industries because of the need to increase reliability and to decrease the possible loss in production due to machine breakdown. In order to predict and overcome the wear related damage progression in gear transmission systems, various condition monitoring techniques have been developed [1, 2] which include vibration, acoustic emission, oil wear and sound analysis [3]. A time-frequency analysis of the fault signals was also carried out based on the vibration signals [4].
Online condition based maintenance was suggested as an effective decision making strategy which helps in diagnosis of forthcoming failures [5] and this kind of online fault diagnosis model can be created using large amount of data, which can be a historical data or experimental data. The industrial processes generate a large amount of operational data through measurements. These huge historical data embed diverse diagnostic patterns or signatures in multivariate time series format which can be extracted to infer knowledge about the equipment status. This type of data process leads to an important data mining problem [6]. In recent years there has been a wide variety of data mining techniques that were applied for fault diagnosis of rotating machinery [7]. The various data mining techniques which include supervised (classification) and unsupervised (clustering) methods had been used to get only the necessary data for training and testing the fault diagnosis model and using that, a lot of pattern recognition problems had been solved in the field of condition monitoring and fault diagnosis. The pattern recognition problem involves feature extraction, classification and clustering methods [8].
Various techniques and algorithms have been developed such as physical model, knowledge based model, data driven model and combination model in which knowledge based model like Fuzzy logic and Artificial Neural Network (ANN) are commonly used [9, 10] for fault diagnosis. Fuzzy logic provides a simple way to arrive at a definite conclusion based on vague and ambiguous information. An intelligent system was commonly used for diagnostics of bearing faults [11, 12]. A lot of pattern recognition problems have been solved in the field of condition monitoring and fault diagnosis and it consists of Feature Extraction and Feature Classification [13]. In many cases the features were optimized using decision tree. Feature classification was done using Fuzzy inference engine, ANN and Support Vector Machine (SVM) [14, 15]. The ANN predictors were used in the vibration analysis of gearing mechanism [16]. In all the online condition monitoring tecniques, statistical features were considered without understanding their importance in the classification of faults. Considering too many features leads to complication in computation and occupation of more memory space as well.
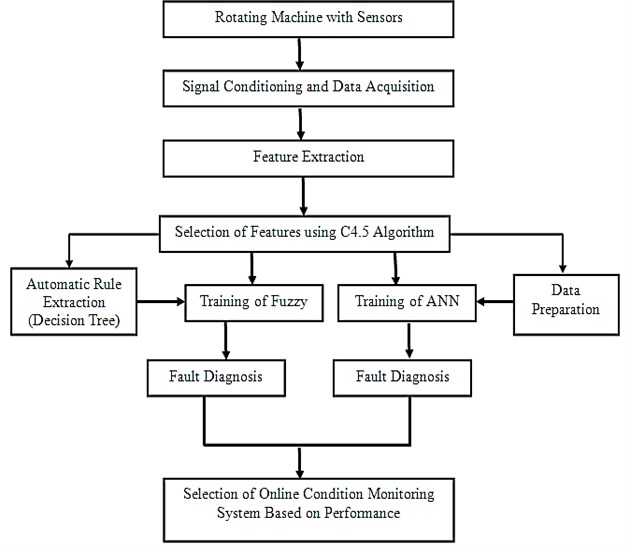
Hence this work presents the decision tree based online condition monitoring and fault diagnostics of spur gear using fuzzy and neuro controller. The best features of the vibration signals are selected using (C4.5 algorithm) decision tree with which the controllers are trained for the classification of faults in spur gear as normal, wear tooth, broken tooth, and broken tooth under loading condition. Figure 1 shows the frame work of intelligent online fault diagnosis system.
Fig. 1The frame work of intelligent fault diagnosis system
2. Experimental studies
The fault simulator is shown in Figure 2. The aim of the experiment was to observe the vibration signals for different conditions of the spur gear such as Normal, Wear Tooth, Broken Tooth and Broken tooth under loading conditions. A single stage spur gear box is used here which consists of two parallel shafts and two gears. In order to initiate wear in the gear in a relatively short time span, the gears used in this experiment are made of En24 steel without any heat treatment.
The gears have a module of 5 mm and pressure angle of 20°. Table 1 gives the dimensions and specifications of the gears used for the present study. Two love-joy couplings connect the driver and driven shafts to the gearbox. The driving shaft is connected to a 5 HP three-phase induction motor which transmits power to it. This motor transmits speed only at 1500 rpm. A Variable Frequency Drive (VFD) is connected to the motor in order to vary the speed and torque as per the requirement. An arm is bolted to the underside of the test bearing and weights are added at the end of this arm to establish the relationship of load with change in torque. When weight is added, there is a change in the torque of the system. This method is simple and effective. Torque can be varied as per the requirement by adding or removing the weights. Also the oil used was SAE 30 without anti wear properties.
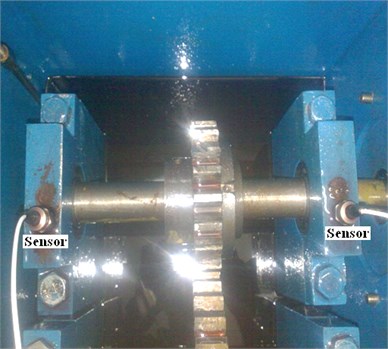
Fig. 2Experimental setup
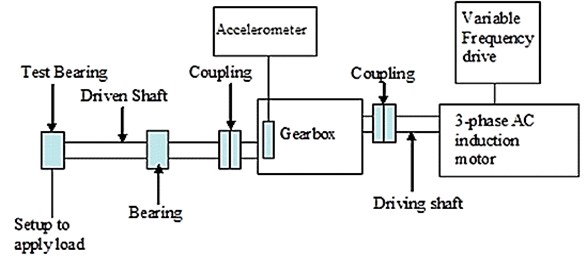
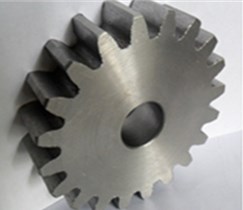
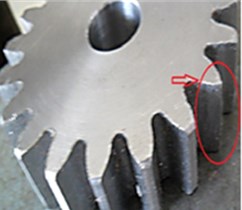
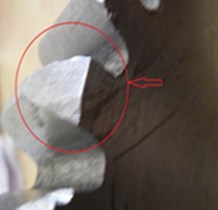
Fig. 3a) View of normal gear, b) view of wear tooth, c) view of broken tooth
a)
b)
c)
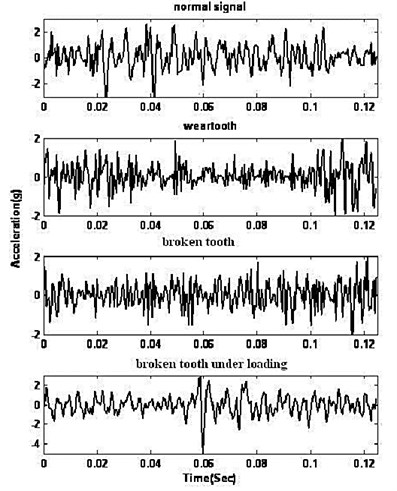
Fig. 4a) experimental setup with the sensors, b) time domain plot of signals
a)
b)
2.1. Experimental procedure
In the present study three pinion wheels are used whose details are as mentioned in Table 1. One was a new wheel and it was free from defects. In the other two pinion wheels defects were created using EDM in order to keep the size of the defect under control. The details of the various defects are depicted in Table 2 and its views are shown in Figure 3(a-c).
After allowing initial running of the gearbox for some time, the vibration signals of left and right bearing of the gearbox were taken using the piezoelectric pickup (K-shear© Accelerometer) which is mounted on the gearbox. The experimental setup with sensor positions is shown in the Figure 4(a). The gearbox was run at different speeds ranging from 100 rpm to 1500 rpm and the corresponding data were collected using a commercial 4-channel data acquisition module NI 9233 and Dewesoft (Version 7.0.2) software. The sample length was 2048 s/sec for all conditions. The sample length was chosen arbitrarily. Many trials were taken at the set speed and vibration signal was stored in the computer memory. The signal is then read from memory and processed to extract different features.
Table 1Dimensions and specifications of gear box used in experiment
Item | Pinion | Wheel |
Center distance (mm) | 150 | 150 |
Pitch diameter (mm) | 100 | 200 |
Module | 5 | 5 |
Number of teeth | 20 | 40 |
Face width (mm) | 25 | 25 |
Pressure angle (degrees) | 20 | 20 |
Gear ratio | 2 | – |
Material properties | ||
Young’s modulus (N/mm2) | 2×10⁵ | |
Poisson’s ratio | 0.3 | |
Material | En 24 | |
Brinell hardness number (BHN) | 230 | |
Table 2Details of faults under investigation
Condition | Fault description | Dimension (mm) |
G1 | Normal | – |
G2 | Wear tooth | 0.7 |
G3 | Broken tooth | 5 |
G4 | Broken tooth under loading | 5 mm and loaded by adding weight (100 N) |
3. Feature extraction
Statistical analysis of vibration signals yields different primary and secondary statistical parameters. We selected many such parameters as the basis for our study. They are range, skewness, kurtosis, standard deviation, variance, sum, maximum value, minimum value, RMS value, median and crest factor. These statistical features that have been extracted from time domain vibration signals are explained below.
3.1. Range
Range refers to the difference in maximum and minimum signal point values for a given signal.
3.2. Skewness
Skewness characterizes the degree of asymmetry of a distribution around its mean. The following formula is used for computation of skewness:
where is the sample mean, is sample size and is the sample standard deviation.
3.3. Kurtosis
Kurtosis is a measure of the peakedness of the probability distribution of a real-valued random variable:
3.4. Standard deviation
Standard deviation is a measure of the effective energy of the vibration signal and it clearly indicates deterioration in the gear condition. The following formula is used for computation of standard deviation:
3.5. Variance
Variance is a measure of how far a set of numbers is spread out. The following formula was used for computation of variance:
3.6. Sum
Sum is the sum of all signal point values in a given signal.
3.7. Maximum value
Maximum value refers to the maximum signal point value in a given signal.
3.8. Minimum value
Minimum value refers to the minimum signal point value in a given signal.
3.9. RMS value
The root mean square is a statistical measure of the magnitude of a varying quantity. It is especially useful when variants are positive and negative:
where is input signal and:
3.10. Median
For computation of median, the signal point values are first sorted in ascending order. If the number of values is odd, the middle value is the median. If the number of values is even, the median is the average of the two middle values.
3.11. Crest factor
The crest factor is defined as the maximum positive peak value of the signal divided by the RMS:
4. Feature selection
A standard tree ID3 or C4.5 algorithm (induction decision) consists of a number of branches, one root, a number of nodes and a number of leaves. A branch is a path of nodes from root to leaf, each node involving one attribute. The presence of the attribute and its position in the tree gives information regarding the importance of that attribute [17]. A decision tree is essentially a tree-based knowledge representation methodology used to represent classification rules. The J48 algorithm (a WEKA implementation of C4.5 algorithm) is most widely used in construction of decision trees [14].
4.1. Application of C4.5 algorithm for feature selection
The C4.5 algorithm has been applied to the problem under discussion. The input to the algorithm is the set of statistical features described in the previous section. From the tree it can be concluded that the top node is the best node for classification. The other features in the nodes of decision tree appear in descending order of importance. It is to be stressed here that only features that contribute to the classification appear in the decision tree and others do not. The level of contribution of each feature is given by a statistical measure within the parenthesis in the decision tree. The first number in the parenthesis indicates the number of data points that can be classified using that feature set. The second number indicates the number of samples against this action. If the first number is negligibly small compared to the number of samples, the corresponding feature can be considered as an outlier and hence ignored. The algorithm identifies the good features for the purpose of classification from the given training data set and thus reduces the domain knowledge required to select good features for pattern classification problem. The decision tree shown in Figure 5 for different faults compared with good condition of the gear. Based on the tree it is clear that of all statistical features RMS value, skewness, sum, minimum and variance play a dominant role in feature classification. These five predominant features are fed as input to train Fuzzy and ANN classifiers.
Fig. 5Decision tree for selected features
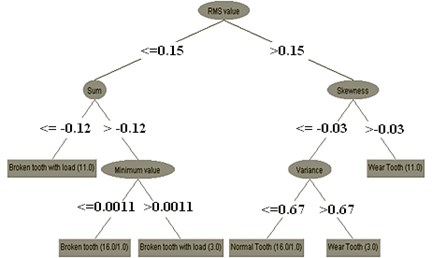
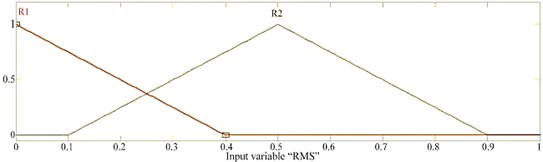
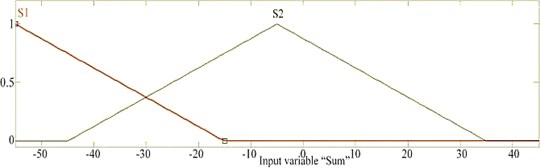
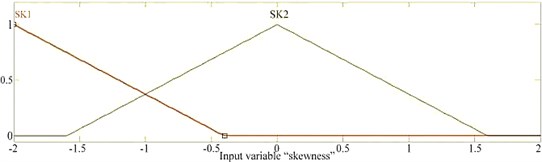
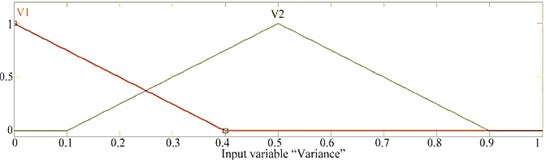
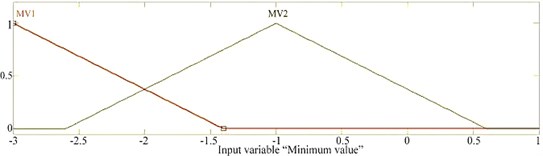
Fig. 6a) membership function for RMS, b) membership function for sum, c) membership function for skewness, d) membership function for minimum value, e) membership function for variance
a)
b)
c)
d)
e)
5. Fuzzy classifier
Fuzzy logic provides a precise approach for working with uncertainty. It is a method in which values of the output vector are assigned by interpreting the values in the input vector based on some set of rules. Rules are a list of if-then statements and are the primary mechanism for mapping an input space to an output space. All rules are evaluated in parallel and the order of the rules is not important. Because fuzzy classifier provides the tools to classify information into broad groupings, it has infinite possibilities for application which have proven to be more effective than other systems in handling complex information [15]. For the problem under discussion, the condition of the gear, normal or faulty is basically fuzzy in nature. All the faults do not occur in the gear instantly, rather they come gradually. Hence fuzzy inference engine is developed using decision tree [18, 19].
5.1. Application of fuzzy classifier in the present work
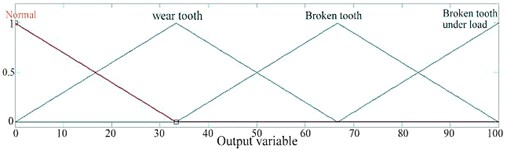
A Membership Function is a curve that displays how each point in the input space is mapped to a membership value between 0 and 1. The branches of the decision tree shown in Figure 5 are created based on observing the values of the features. The membership functions for all five features are defined and presented in Figures 6(a-e) for RMS, sum, skewness, minimum value and variance respectively. There are four possible outcomes from the fuzzy classifier, namely normal, wear tooth, broken tooth and broken tooth under load. Hence four equal ranged membership functions are defined as shown in Figure 7. Triangular membership function is used in the present study. The selection of the membership function is to some extent arbitrary.
5.2. Rule generation from decision tree
The decision tree obtained in Figure 5 is used to generate a set of ‘if-then’ rules, which form the knowledge base for the fuzzy classifier. Tracing the path from the root node to a branch leads to a condition of the gear and decoding the information available in the form of ‘if-then’ statement gives the following rules:
RULE 1: if (RMS is R1) and (SUM is S1) then (condition is Broken Tooth with Load),
RULE 2: if (RMS is R1) and (SUM is S2) and (Minimum value is MV1) then (condition is Broken Tooth),
RULE 3: if (RMS is R1) and (SUM is S2) and (Minimum value is MV2) then (condition is Broken Tooth with Load),
RULE 4: if (RMS is R2) and (Skewness is Sk1) and (Variance is V1) then (condition is Normal Tooth),
RULE 5: if (RMS is R2) and (Skewness is Sk1) and (Variance is V2) then (condition is Wear Tooth),
RULE 6: if (RMS is R2) and (Skewness is Sk2) then (condition is Wear Tooth).
Fig. 7Membership function for condition (output)
5.3. Fuzzy inference engine
After generating the rules, the next step is to build the fuzzy inference engine. The fuzzy toolbox available in MATLAB R2008a was used for building fuzzy inference engine. Membership functions and fuzzy operators were used to enter each rule, taken one at a time. These rules were entered in the place meant for it in the GUI of the fuzzy toolbox. The rules were obtained from a training data set (30 trials in each condition). For testing the model a portion of the data called testing data was kept aside. The performance of the fuzzy inference engine was evaluated using the testing data and its performance was presented as confusion matrix in Table 3. The diagonal elements in the confusion matrix show the number of correctly classified instances. In the first row the first element shows the number of data points belonging to the ‘Normal’ class and classified by the fuzzy logic as ‘Normal’. The second element in the first row shows the number of data points belonging to the ‘Normal’ class and misclassified by fuzzy logic as ‘Wear tooth’. The third element shows the number of data points misclassified as ‘Broken tooth’ and so on.
5.4. Defuzzification
In many situations, for a system whose output is fuzzy, it is easier to take a crisp decision if the output is represented as a single scalar quantity. This conversion of a fuzzy set to a single crisp value is called defuzzification and is the reverse process of fuzzification. Several methods are available of which the widely used methods are Centroid method, Centre of sums and Mean of maxima. In our problem we selected centroid method for defuzzification. In confusion matrix the terms used are: A – Normal tooth, B – Wear tooth, C – Broken tooth, D – Broken tooth under load.
Table 3Confusion matrix
Condition | A | B | C | D |
A | 30 | 0 | 0 | 0 |
B | 2 | 28 | 0 | 0 |
C | 0 | 2 | 28 | 0 |
D | 0 | 2 | 0 | 28 |
6. Artificial neural network
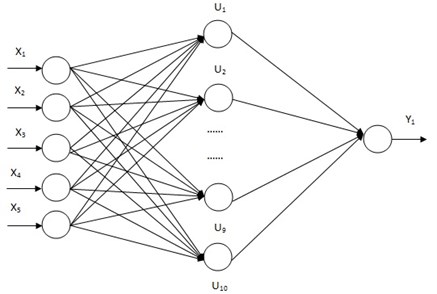
Artificial neural network is being used for automated detection and diagnosis of machine conditions. Among different types of ANN, multilayer feed forward network (MLFFN) with back propagation algorithm is popular method. In MLFFN model the Back propagation algorithm is used as a supervised system for known input and output conditions. It consists of an input layer of the source nodes, one or more hidden layer and an output layer. The number of input and output layers depends on number of input / output in the problem. The hidden layer affects the generalization capability of the network. Figure 8 shows the typical topology of back propagation architecture used in this work. There are four inputs and one output. For a better understanding, the back propagation learning algorithm can be divided into two phases: propagation and weight updating. Propagation involves following steps: (i) forward propagation of a training pattern’s input through the neural network in order to generate the propagation’s output activations, (ii) back propagation of the propagation’s output activations through the neural network using the training pattern’s target in order to generate the incremental output (deltas) of hidden neurons. The activation function used in calculation here is logistics (log-sigmoid), it is given by:
For each of weight update the following steps are followed: (i) multiply its output delta and input activation to get the gradient of the weight, (ii) bring the weight in the opposite direction of the gradient by subtracting a ratio of it from the weight.
Fig. 8Artificial neural network structure
6.1. Data preparation
The selected best five features (RMS value, sum, skewness, minimum and variance) from the decision tree have been used as inputs to train the ANN model. Normal, wear tooth, worn out tooth, worn out tooth under loading conditions are taken as output of the ANN model. The data set has been prepared from the various signals taken from the experimental setup.
6.2. Application of ANN in the present work
The features of vibration signals taken from the experimental setup are set as the input data for this ANN model. As discussed in application of decision tree for feature selection and according to the result obtained in the decision tree the five good features are selected (RMS, sum, skewness, minimum and variance) as input data for training the ANN model. The input data set is normalized and is subjected to corelation data test on various parameters using statistical methods. The training method adopted is termed as being of a supervised nature. The particular network consists of an input layer with five input neurons, a hidden layer with ten neurons and an output layer with one neuron. The network is presented with a set of input data along with a desired output. The network shows several training examples repetitively and attempts to adjust its interconnecting weights in order to minimize the error between its output and target over the entire training data set. The ability of the network to learn and generalize the corelation between inputs and targets is then tested by presenting the network with data and analyzing the network response in terms of the accuracy of its output compared with desired output.
7. Results and discussion
7.1. Fuzzy
Each branch of the obtained decision tree is converted into an ‘if-then’ rule and inputted as knowledge base to a fuzzy inference engine. A fuzzy model for the current fault diagnostics problem investigated is thus built. The result of the fuzzy model is presented in Table 3. Observing the confusion matrix only two of the faulty conditions are misclassified as ‘normal’. Misclassification is only among faulty conditions and they are less than 7 %, so the result of fuzzy model is 95 %. In the present study triangular membership function is used, the selection of which is to some extent arbitrary.
7.2. ANN
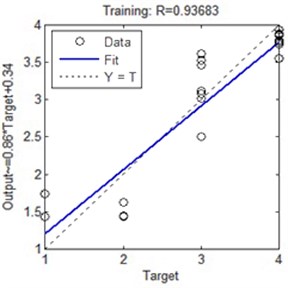
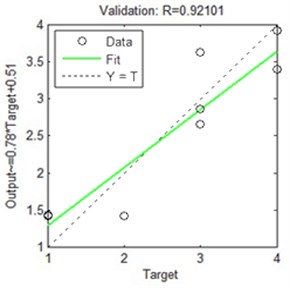
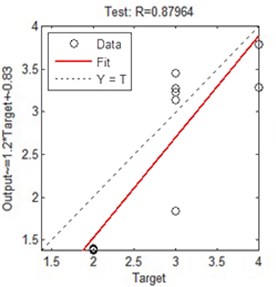
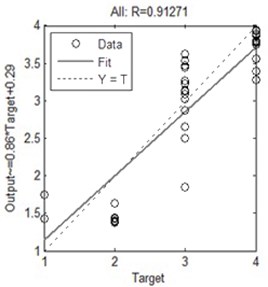
ANNs of the back propagation type were trained using training data set. The regression value is plotted against the target output.
Fig. 9ANN regression plot
a)
b)
c)
d)
After 1000 iterations the regression value R comes closer to the target value and reveals no more significant change in error with further increase in number of epochs. The testing and validation errors are also less as seen from close proximity of the curves. Thus this heuristic model can be used in the field of condition monitoring as gear problems could be identified and alarmed through a comparison of actual and estimated variables with appropriate messages being generated if the estimated levels of any input variables differ significantly from nominal level over a period of time. Figure 9(a-d) illustrates the regression plot of ANN model, which shows that for the regression value of training, validation, testing and overall performance, and it is observed that the overall performance of the ANN controller is 91.27 %.
8. Conclusions
The online fault diagnosis of spur gear is done using fuzzy controller and ANN controller. The performance is discussed and the results show that the fuzzy controller (95 %) is better than the neuro controller (91 %). The features of the signals are optimized using decision tree and only the best features have been selected as inputs (RMS, Sum, Skewness, Minimum value and Variance) for training both the controllers out of eleven features. Thus the use of decision tree minimizes the involvement and need of human expertise. This kind of knowledge based system can be used for online condition monitoring of gear box in industries.
References
-
Ying Peng, Ming Dong, Ming Jian Zuo Current status of machine prognostics in condition based maintenance: a review. The International Journal of Advanced Manufacturing Technology, Vol. 50, Issue 1-4, 2010, p. 297-313.
-
Rao B. K. N. The Handbook of Condition Monitoring. Elsevier Science, 1st Edition, 1996.
-
Paul D. Samuel, Darryll J. Pines A review of vibration based techniques for helicopter transmission diagnostics. Journal of Sound and Vibration, Vol. 282, Issue 1-2, 2005, p. 475-508.
-
Zhongyuan Su, Yaoming Zhang, Minping Jia, Feiyun Xu, Jianzhong Hu Gear fault identification and classification of singular value decomposition based on Hilbert-Huang transform. Journal of Mechanical Science and Technology, Vol. 25, Issue 2, 2011, p. 267-272.
-
Andrew K. S. Jardine, Daming Lin, Dragan Benjevic A review on machinery diagnostics and prognostics implementing condition based maintenance. Mechanical Systems and Signal Processing, Vol. 20, Issue 7, 2006, p. 1483-1510.
-
Hesam Komari, Alaei Karim Salahshoor, Hamed Komari Alaei A new integrated on-line fuzzy clustering and segmentation methodology with adaptive PCA approach for process monitoring and fault detection and diagnosis. Soft Computing, Vol. 17, 2013, p. 345-362.
-
Y. Lei, Z. He, Y. Zi, Q. Hu Fault diagnosis of rotating machinery based on a new hybrid clustering algorithm. International Journal of Advanced Manufacturing Technology, Vol. 35, 2008, p. 968-977.
-
Jain A., Murty M. N., Flynn P. J. Data clustering: a review. ACM Computing Surveys, Vol. 31, Issue 3, 1999, p. 264-323.
-
Zeng L., Wang H. P. Machine-fault classification: a fuzzy-set approach. The International Journal of Advanced Manufacturing Technology, Vol. 6, Issue 1, 1991, p. 83-94.
-
Huang Y. C., Yang H. T., Huang C. L. Developing a new transformer fault diagnosis system through evolutionary fuzzy logic. IEEE Transactions on Power Delivery, Vol. 12, Issue 2, 1997, p. 761-767.
-
Fagang Zhao, Jin Chen, Lei Guo, Xinglin Li Neuro-fuzzy based condition prediction of bearing health. Journal of Vibration and Control, Vol. 15, Issue 7, 2009, p. 1079-1091.
-
Marichal G. N., Artés M., García-Prada J. C. An intelligent system for faulty-bearing detection based on vibration spectra. Journal of Vibration and Control, Vol. 17, Issue 6, 2011, p. 931-942.
-
Samanta B. Gear fault detection using artificial neural networks and support vector machines with genetic algorithms. Mechanical Systems and Signal Processing, Vol. 18, Issue 3, 2004, p. 625-644.
-
Sugumaran V., Muralidharan V., Ramachandran K. I. Feature selection using decision tree and classification through proximal SVM for fault diagnostics of roller bearing. Mechanical Systems and Signal Processing, Vol. 21, Issue 2, 2007, p. 930-942.
-
Ajith Kumar R., Sugumaran V., Gowda B. H. L., Sohn C. H. Decision tree: a very useful tool in analysing flow-induced vibration data. Mechanical Systems and Signal Processing, Vol. 22, Issue 1, 2008, p. 202-216.
-
Selcuk Erkaya Analysis of the vibration characteristics of an experimental mechanical system using neural networks. Journal of Vibration and Control, Vol. 18, Issue 13, 2012, p. 2059-2072.
-
Peng Y. H., Falch P. A., Brazdil P., Soares C. Decision-tree based data characterization for meta-learning. ECML/PKDD-2002 Workshop IDDM, 2002, p. 111-122.
-
Sugumaran V., Ramachandran K. I. Automatic rule learning using decision tree for fuzzy classifier in fault diagnosis of roller bearing. Mechanical Systems and Signal Processing, Vol. 21, Issue 5, 2007, p. 2237-2247.
-
Cox E. The Fuzzy dSystems Handbook – A Practitioner’s Guide to Building, Using and Maintaining Fuzzy Systems. Academic Press, New York, 1994.
About this article
This work was partially supported by Caterpillar Foundation Grant (No. 7737/PD5/caterpillar), Planning and Development Department of Anna University, Chennai, India. Authors are also grateful to the editors and reviewers for their constructive comments.
