Abstract
Wheel alignment is an important item of vehicle detection to ensure the vehicle safety. The precision of wheel alignment is determined by the benchmark line which is the center line of the vehicle frame. A measurement method of the benchmark line for the deformed frame of heavy vehicle is deduced by constructing a model which consists of a laser bar with two laser range finders and a measurement bar with scale. The simulations are performed on a model of typical heavy vehicle CA1190 whose frame size is 11230 mm×860 mm. The simulation results of the center points are solved by the least squares method while the fitting line of the points for the benchmark line is also achieved in the simulation.
1. Introduction
Wheel alignment is a key part of automobile maintenance that consists of adjusting the angles between wheels and vehicle frame [1]. The purpose of measuring these angles is to reduce the tire wire and to ensure that the vehicle is driven in a straight line safely [2-6]. Some emergencies of vehicles on highway are related to the unreasonable value of the wheel alignment [7-10]. The angles in the horizontal plane are commonly defined by the frame centerline in the case of passenger cars. However the current measurement model of the wheel alignment cannot be utilized for heavy commercial vehicles if the frame is deformed by vibration, partial load or over load, accident, etc. For the measurement accuracy of heavy vehicles, the benchmark line of the deformed frame should be exactly explored before the inspection of the wheel alignment. For this reason, it is important to develop the measurement method to provide the benchmark line for the deformed frame of heavy vehicle.
The inspection models of the angles of the wheel alignment itself using various methods are deeply explained in the published theories [11, 12]. January D. B. studies the steering geometry of a vehicle and proposes a solution for the two angles of steering angle inclination (SAI) and caster [13]. The approximate calculation formulae of SAI and caster are also outlined in the paper. To evaluate the errors of the approximate calculation formulae for SAI and caster, an accurate model is constructed and calibration equipment is established to enhance the measurement precision [14]. Nozaki H. reports a method of measuring side slip for toe angle and camber angle, separately [15]. Cho Y. G. presents a method for the maximum steering wheel angle based on the vehicle steering returnability [16]. However the research about the measurement benchmark of wheel alignment in horizontal plane is not found in previous works.
The purpose of the study in this paper is to solve the problem of deducing the centerline of a deformed frame which is considered as the benchmark for measuring the parameters of the wheel alignment. The benefit of the research is to improve the test precision by a more accurate benchmark line of heavy vehicle.
2. Measurement method
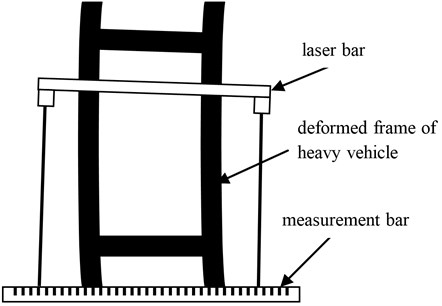
The measurement model for the central line of the deformed frame is described in Fig. 1. As there are the machining holes on the frame which are considered as the accurate manufacturing benchmark, a self-aligning laser bar and a measurement bar are designed for inspection and installed with the holes on the frame. The center of the self-aligning laser bar coincides with the local center of the frame. Furthermore, the centerline of a deformed frame can be obtained by adopting the least squares method in the central point group. The laser bar consists of two laser range finders symmetrically located at the both ends of the bar. Each of them is employed to test the distance between the laser bar and the measurement bar. The measurement bar with a marked scale is positioned in the front of the frame. The laser bar moves or rotates with the deformation of the frame. The projected points of the laser range finders on the measurement bar are numerated by the scale.
Fig. 1Measurement method of the benchmark line for the deformed vehicle frame
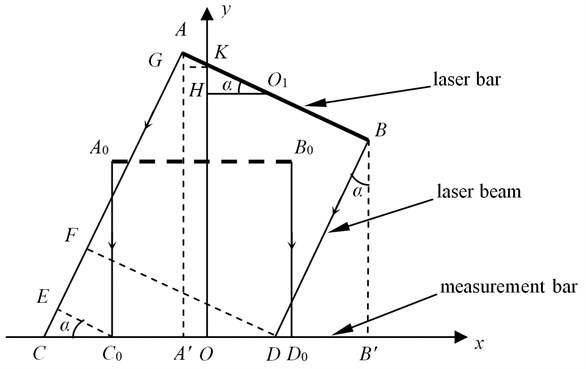
An abstractive graphic of Fig. 1 is illustrated in Fig. 2. The axis is set along with the measurement bar. is the laser bar attached on the deformed frame with the machining holes. , are the projected points of the laser range finder on the measurement bar. , are the calibration points on the measurement bar which are defined by the two projected points when the laser bar is parallel to the measurement bar. The distances of and are observed from the measurement bar and signed by and . , , and are the same with the known length of the laser bar . The measurement results and of the laser range finders are noted by and , respectively. and are drawn parallel to . and are vertical to .
Fig. 2Measurement model of the benchmark line for the deformed vehicle frame
From the similarity of triangles, the relationship of line segments is:
Subscribe the line symbols, then:
and:
the angle is calculated by:
after that:
then:
The coordinate of is:
The coordinate of is:
The final coordinate of is solved to:
3. Simulation results
The model of heavy vehicle CA1190 whose chassis consists of one front axle with two wheels and two rear axles with four wheels is constructed to prove the proposed method for the benchmark line on the center of the deformed frame. The technical parameters are outlined in Table 1.
The vehicle model in Fig. 3 is established by Solidworks and the proportion is 1:1. The measurement bar is fixed on the rear of the frame. The laser bar is installed on eight different positions of the deformed frame. The simulation results are given in Table 2. The input values , , and of the Eq. (11) are tested by the ruler in Solidworks. In the simulation, the length of the laser bar is 2800 mm.
Table 1The parameters of the heavy vehicle
Length (mm) | Width (mm) | Height (mm) | Axles distance (mm) | Front wheels distance (mm) | Rear wheels distance (mm) | Frame width (mm) |
11230 | 2495 | 2860 | 5265/1450 | 1914 | 1860 | 860 |
Fig. 3Simulation model
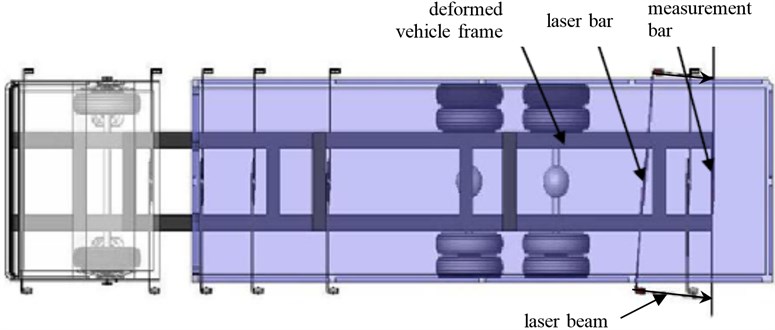
Table 2The simulation results of the centerline points
(mm) | (mm) | (mm) | (mm) | (mm) | (mm) |
23.66 | -8.24 | 514.16 | 219.86 | 22.59 | 364.0 |
-53.79 | 61.25 | 687.42 | 891.92 | -7.39 | 787.6 |
-86.94 | 97.63 | 936.37 | 1181.34 | -10.50 | 1054.8 |
57.17 | -53.33 | 2084.47 | 1937.72 | 50.26 | 2008.3 |
-15.91 | 18.58 | 2030.25 | 2152.51 | -76.68 | 2089.4 |
-25.36 | 27.06 | 3567.47 | 3665.25 | -101.44 | 3614.1 |
-196.12 | 198.49 | 6163.55 | 6278.92 | -60.86 | 6215.9 |
210.32 | -207.66 | 7182.17 | 7060.03 | 101.98 | 7114.3 |
The benchmark line of the deformed frame is calculated by the least squares method according to the center coordinates in Table 2. The equation of the benchmark line is:
4. Conclusions
The center line of the vehicle frame is an important benchmark for measuring the parameters of wheel alignment which is crucial in terms of vehicle safety. The precision of wheel alignment is partially determined by the benchmark line. However the test error is often observed in the case of the deformed frame which is caused by traffic accidents or overloading and so on. A method of the benchmark line for the deformed frame of heavy vehicle is presented in this paper. A laser bar with two laser range finders and a measurement bar with scale are implemented in the constructed model. The normal case of deriving the center point of the deformed frame with translational and rotational motions is considered as broadly representative. The simulations are performed on a model of typical heavy vehicle CA1190 whose frame size is 11230 mm×860 mm. The simulation results of the center points are solved by the least squares method while the fitting line of the points for the benchmark line is also achieved in the simulation. For the future applications the method will promote the measurement precision of the wheel alignment parameters of heavy vehicle.
References
-
Moon I. D., Oh C. Y. Computational model for analyzing the kinematics and compliance characteristics of a commercial vehicle's front suspension system. International Journal of Automotive Technology, Vol. 13, Issue 2, 2012, p. 279-284.
-
Ramirez M., Diaz V., Garcia-Pozuelo D. A test for lateral vehicle safety related to road design. Proceedings of the Institution of Civil Engineers – Transport, Vol. 165, Issue 3, 2012, p. 187-194.
-
Miha P., Darko V., Grega O., Iztok P., Matjaz S. Modifying the brake drum geometry to avoid self-excited vibrations and noise. Journal of Vibroengineering, Vol. 14, Issue 2, 2012, p. 751-758.
-
Cho Y. G. Static and dynamic wheel alignment analysis of steering drift under straight braking. International Journal of Vehicle Design, Vol. 56, Issue 1-4, 2011, p. 4-18.
-
Li X. T., Xu G., Liu J. F., Wray T. J., Agarwal R. K. The research on a novel levitation stage using ultrasonic and aerodynamic driving method. Journal of Vibroengineering, Vol. 15, Issue 1, 2013, p. 492-499.
-
Ragulskis K., Vasiliauskas R., Patasiene L., Fedaravicius A. 3D holographic visualization of vibrations of cylindrical piezoceramic transducers. Journal of Vibroengineering, Vol. 14, Issue 3, 2012, p. 1306-1312.
-
Koronias G., Theodossiades S., Rahnejat H., Saunders T. Static and axle whine phenomenon in light trucks: a combined numerical and experimental investigation. Proceedings of the Institution of Mechanical Engineers Part D – Journal of Automobile Engineering, Vol. 225, Issue D7, 2011, p. 885-894.
-
Bera T. K., Bhattacharya K., Samantaray A. K. Evaluation of antilock braking system with an integrated model of full vehicle system dynamics. Simulation Modelling Practice and Theory, Vol. 19, Issue 10, 2011, p. 2131-2150.
-
Haufe S., Treder M. S., Gugler M. F., Sagebaum M., Curio G., Blankertz B. EEG potentials predict upcoming emergency braking during simulated driving. Journal of Neural Engineering, Vol. 8, Issue 5, 2011, p. 056001.
-
Cho Y. G. Steering pull and drift considering road wheel alignment tolerance during high-speed driving. International Journal of Vehicle Design, Vol. 54, Issue 1, 2010, p. 73-91.
-
Xu G., Li X. T., Su J., Pan H. D., Tian G. D. Precision evaluation of three-dimensional feature points measurement by binocular vision. Journal of the Optical Society of Korea, Vol. 15, Issue 1, 2011, p. 30-37.
-
Xu G., Li X. T., Su J., Chen R., Liu J. F. A method for the estimation of the square size in the chessboard image using gray-level co-occurrence matrix. Measurement Science Review, Vol. 12, Issue 2, 2012, p. 68-73.
-
January D. B. Steering Geometry and Caster Measurement. SAE Techical Paper: 850219.
-
Xu G., Su J., Chen R. Zhang L. B., Su L. L. Error analysis of measurement model and calibration method for automobile caster. Journal of Jilin University – Engineering and Technology Edition, Vol. 38, Issue 1, 2008, p. 17-20.
-
Nozaki H. Technique of separate measuring side slip for toe angle and camber angle. International Journal of Automotive Technology, Vol. 7, Issue 6, 2006, p. 681-686.
-
Cho Y. G. Vehicle steering returnability with maximum steering wheel angle at low speeds. International Journal of Automotive Technology, Vol. 10, Issue 4, 2009, p. 431-439.
About this article
This project is supported by the National Natural Science Foundation of China under Grant No. 51205164.
