Abstract
For the misalign-rubbing coupling fault rotor-bearing system caused by misaligned bearing, the mechanical model and finite element model of dual-disk misalign-rubbing coupling fault rotor-bearing system were established in this paper. The research on dynamics characteristics about the effect of rubbing stiffness, misaligned angle, friction coefficient, rubbing interval and rotational speed on the system was done with the equivalent misaligned moment, nonlinear finite element method and contact theory. Through the relevant research and analysis, it was found that misalign-rubbing coupling fault mainly embodied in the rubbing fault. It was also found that frequency-doubled appeared very early and its peak increased rapidly. This feature can be as a basis which can diagnose misalign-rubbing coupling fault.
1. Introduction
Misaligned rotor would cause axial and radial alternating force of a certain system, and in turn cause axial and radial vibration. When rotor’s misaligned amount is significant, it would cause a series of damages to equipments. Misaligned rotor motion would lead to regenerated problems such as excessive vibration, bearing wearing, large deflection of axis, rotor and stator rubbing, etc. As for sophisticated rotor systems, rubbing problems occur concurrently, i.e. occurring simultaneously at various parts, which leads to unstable motion of rotor system and in turn shaft damage.
In recent years relevant studies on the sophisticated dynamic phenomena in misaligned rotor and rubbing problems have been carried out by researchers both at home and abroad and important results have also been achieved. Haiyan Hu and Shaw [1-3], etc., studied on piecewise linear system, found that local smoothing model is a simple way of overcoming the difficulties encountered in numerical simulation. Guo Chen [4] established the dynamic model of the imbalance-rubbing coupling fault of the rotor system supported by rolling bearing, studied the system bifurcation and conducted the chaotic characteristics analysis. He found that the period-doubling bifurcation and the paroxysmal bifurcation could be ways toward chaos. Xingyang Li [5] analyzed the causes of misaligned force, studied the impact of misaligned rotor and rubbing faults on system response in his shaft coupling misaligned force model. Zhiwei Huang [6], using the numerical integration method, studied the dynamic behavior of misaligned-rubbing coupling fault rotor system varying in accordance with misaligned parallel amount and declination parameters. This paper, using the finite element method, established a misaligned-rubbing coupling fault double-disk rotor bearing system, which takes the influence of shaft coupling into account, using the Newmark- method of solving the numerical solution of non-autonomous nonlinear systems, analyzed the bifurcation behavior of the misaligned-rubbing coupling rotor bearing system’s periodic motion in different rubbing stiffness and misaligned angle parameter domain. It found the law of stableness and instability of periodic motion, which serves as theoretical reference for fault diagnosis, vibration control and stable functioning of the rotor bearing system.
2. Mathematical model of double-disk misalign-rubbing coupling fault rotor
2.1. Mechanical model of rotor system
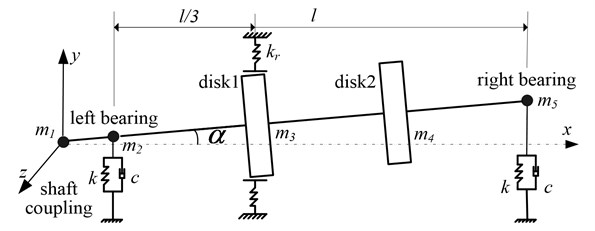
In order to simulate the fact, this paper considered the gyroscopic effect and torsion moment of the shaft coupling when establishing model. It established the double-disk rotor-bearing system, which consists of 2 disks and 2 elastic supporting bearings, as shown in Figure 1. The span between the 2 bearings is ; the distance between disk 1 and the left bearing and that between disk 2 and the right bearing are both ; , are equivalent supporting stiffness and damping respectively; ( 1, 2, … ,5) is the mass of shaft coupling, bearing and disk; there is a casing with disk 1.
Fig. 1Mechanical model of rotor bearing system
2.2. Misaligned moment
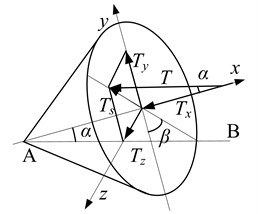
The different elevation between the two disks leads to misaligned fault, the change of the center line of bearing would usually cause an inclination angle between rotor shaft and motor driving shaft, as shown in Fig. 1. The misaligned angle between rotor shaft and the motor driving shaft is . Projecting the motor shaft to a plane, the angle between projection axis and axis is , as shown in Fig. 2 [7]. The torque of the motor , passing through elastic shaft bearing to rotor, can be broken down into two parts, and :
where is the torque passed to rotor, is the moment perpendicular to rotor radial.
Fig. 2Mechanical model of misaligned rotor system
They can be further broken down into two bending moments along axis and axis:
According to Euler equations of motion, , , can also be expressed as:
where is the angular velocity of rotor, is the moment of inertia centering .
Because the rotor only rotates around axis, the above-mentioned equation can be simplified as:
where is the polar moment of inertia, is the angular acceleration of the rotor.
For rotor and motor with angle , their angular velocity satisfies the following relation:
where is the angular velocity of rotor, is the angular velocity of motor, is the rotation angle of the motor shaft, .
Differentiating Eq. (5) directly one can obtain:
Substituting Eq. (7) into Eq. (4) one can obtain misaligned moment :
2.3. Mathematical model of rotor system
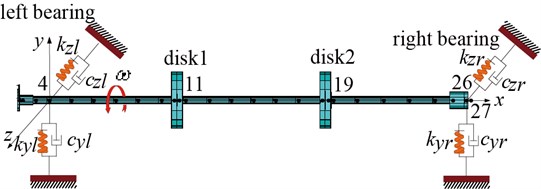
Fig. 3 shows the finite element model, the rotor system shown in Fig. 1 that is made discrete. The dots in the figure denote nodes with their numbers. The mass of the shaft coupling and the disks are born on the node 1, 11 and 19, and the two supporting bearings are simplified as spring-damper. The misaligned fault is simulated by misaligned moment. For the rubbing force model, see in reference [8]. The whole rotor system’s motion equation can be described as:
where are the system’s mass matrix, gyroscopic matrix and stiffness matrix respectively, are the unbalanced force, rubbing force and misaligned moment.
Fig. 3Element model of rotor bearing system
3. Non-linear dynamic analysis of double-disk coupling fault rotor system
This paper mainly focuses on the influence of rubbing stiffness and misaligned angle to system’s dynamic characteristics. The main parameters are as follows: shaft diameter is 10 mm, shaft length is 562 mm, distance between left supporting shaft and shaft coupling is 32 mm, disk diameter 80 mm, disk thickness 15 mm, bearing stiffness 2e5 N/m, damping 2e3 N/m, rotational speed 4500 r/min that is between first-order and second-order critical rotational speed, friction coefficient 0.3, rubbing clearance 210 μm, misaligned angle 15°.
In order to fully understand the dynamic behavior of bearing misaligned double-disk rotor of the shaft doubling, the system’s non-linear dynamic response should be studied first. Because the system’s non-linear characteristic is significant, this paper chooses the Newmark- method [9], which does not require high precision for the integral step, to do the numerical integration and acquire rotor response, and it also considered the influence of gyroscopic effect at the shaft coupling end on the system.
3.1. Influence of rubbing stiffness
Suppose that the eccentric mass is only applied on the two disks and shaft coupling, and the unbalance quantity is 56e-6 kg.m and 74e-7 kg.m respectively, and the misaligned angle is fixed at 15°. The (a)-(c) in Fig. 4 are the time-domain graph, orbit diagram, frequency spectrogram and Poincare graph with the rubbing stiffness being 1×10⁷ N/m, 8×10⁷ N/m and 2×10⁸ N/m.
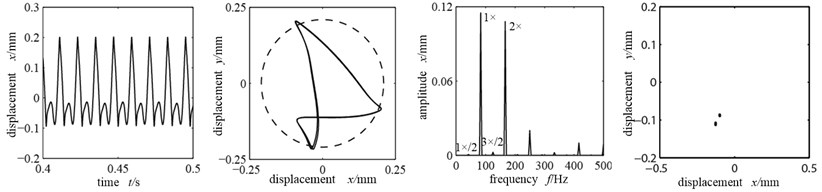
Fig. 4Time-domain graph, orbit diagram, frequency spectrogram and Poincare graph of rotor system with the change of rubbing stiffness
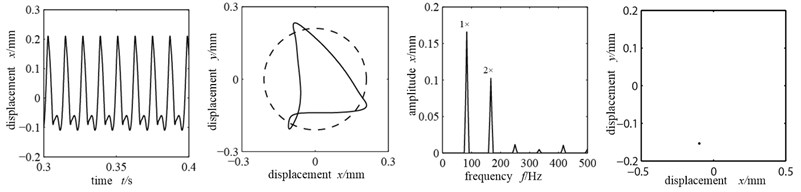
a) Rubbing stiffness 1×10⁷ N/m
b) Rubbing stiffness 8×10⁷ N/m
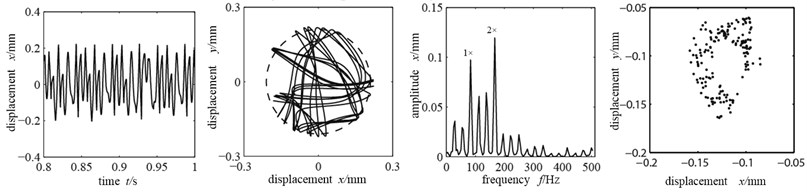
c) Rubbing stiffness 2×10⁸ N/m
Because the rotational speed reaches 4500 r/min, far exceeding the first-order critical rotational speed, the unbalance force at the disks is large and there is radial misaligned moment, which would probably cause the rotor-stator rubbing. As shown in Fig. 4(a), time-domain waveform is distorted and there is wave clipping; axis orbit crosses with dotted line circle (where the stator sits) and takes an “8” shape, indicating significant single-point local rubbing characteristic [10-12]; the rubbing stiffness is relatively low and the system mainly does working frequency motion. With the misaligned moment, double frequency peak is relatively large, while the other high frequency components are relatively small. There is a single dot that appears in Poincare graph, which shows that the system is doing cycle 1 motion. Fig. 4(b) is the time-domain graph, orbit diagram, frequency spectrogram and Poincare graph with the rubbing stiffness being 8×10⁷ N/m. At this time the increased rubbing stiffness makes the axis orbit’s “8” shape more significant, frequency components more abundant, and the high frequency peak increases significantly with a 1×/2 frequency division; the Poincare graph shows two single dots, all of which indicate the system’s frequency division motion characteristics, changing from cycle 1 to cycle 2 motion. When the rubbing stiffness shifts to 2×10⁸ N/m, the time-domain waveform and axis orbit are in confusion. Seeing from the Poincare graph and frequency spectrogram, there appear many dispersed dots. The axis orbit becomes complicated and the frequency spectrogram appears continuous spectra, all indicating that the system is doing chaotic motion.
3.2. Influence of the misaligned angle
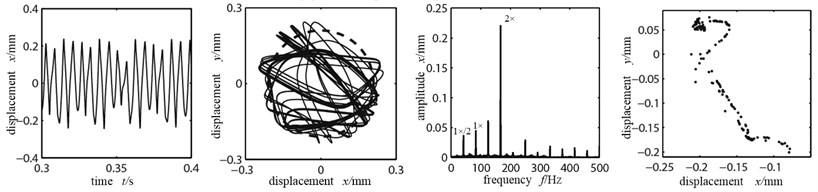
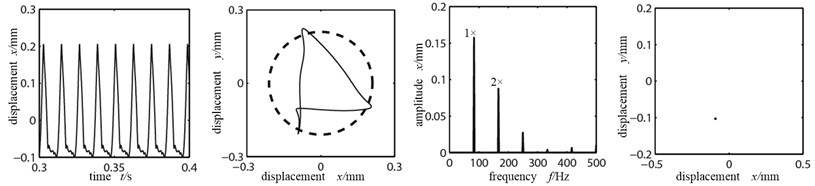
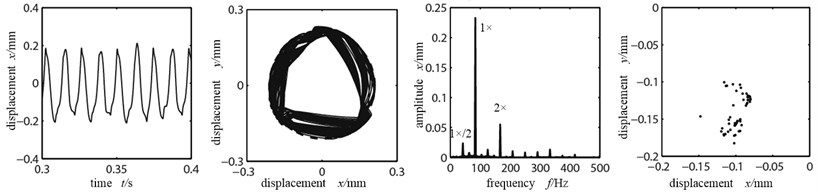
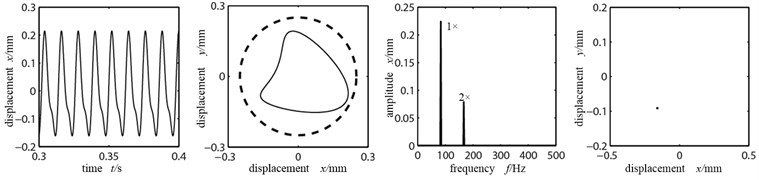
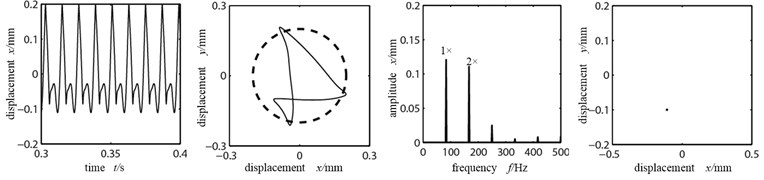
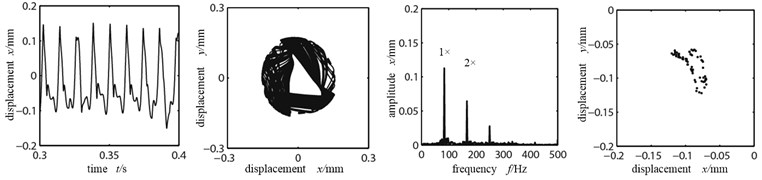
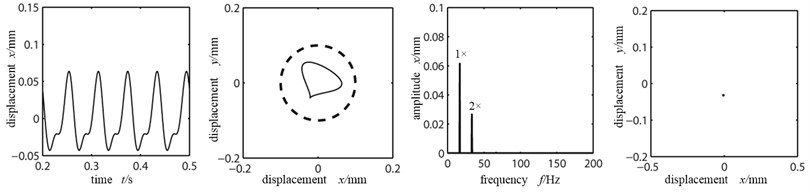
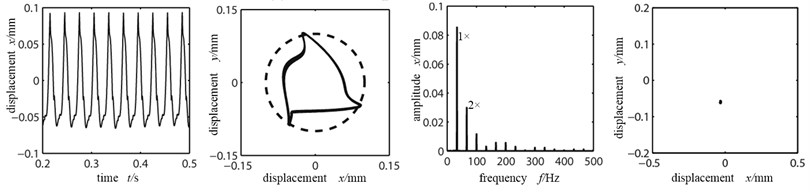
When the rotational speed 4500 r/min and the rubbing stiffness 3×10⁷ N/m, Fig. 5(a-d) are the time-domain graph, orbit diagram, frequency spectrogram and Poincare graph of rotor system at the left disk with the misaligned angle being 10°, 15°, 18° and 20°.
As shown in the orbit diagram in Fig. 5(a), when the misaligned angle is small, rubbing does not appear; the time-domain waveform is a sinusoid, indicating that the system is in cycle 1 motion. However with the existence of misaligned moment, the axis orbit takes a concave shape and the double frequency high order division appears, showing the misaligned fault characteristics. When the misaligned angle is 15°, in the time-domain appear clippings and the orbit changes significantly, showing rubbing fault characteristics. In frequency spectrogram, 1×/2 frequency division appears and the double frequency amplitude exceeds the working frequency, showing significant misaligned fault characteristics; Poincare graph shows two single dots, indicating that the system shifts from cycle 1 to cycle 2 motions. When the misaligned angle reaches 18°, the rubbing condition aggravates further, and the axis orbit is in confusion. In frequency spectrogram the double frequency is significantly larger and continuous spectra appear. In Poincare graph there are many dispersed dots, indicating that the system is in chaos. When the misaligned angle further increases to 20°, the axis orbit is an ellipse, indicating integer cycle rubbing condition. Because the friction increases the system’s stiffness, the wave’s peak in time-domain graph is small compared with the peak in Fig. 5(a), and its cycle is smaller. Because the misaligned angle becomes larger, the disk 1 enters into whole circle rubbing condition and the radial misaligned moment attaches more influence; double frequency high order division being the main frequency, vibration response spectra are abundantly discrete; higher harmonic component has relatively more energy; the contact stiffness is relatively small, thus there is no rebound force; the Poincare graph shows one single dot, indicating the system enters into cycle 1 motion via inverted bifurcation.
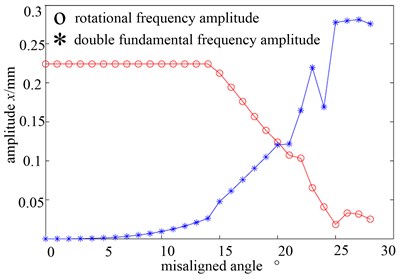
Misaligned fault would cause radial vibration; vibration frequency is the double fundamental frequency. There are also multiple frequency vibrations, but mainly one and double fundamental frequency. The more serious the misaligned fault, the larger proportion of the double frequency accounts. After studying the one and double fundamental frequency’s peak trend of the misaligned-rubbing coupling fault rotor system, it helps to determine the severity of the fault. Fig. 6 is the curve graph of one and double fundamental frequency with the change of misaligned angle when rotational speed is 4500 r/min. As shown in Fig. 6, when the misaligned angle is smaller than 15°, one time fundamental frequency peak fluctuates in 0.2242 with small change. The double fundamental frequency peak is gradually rising, when the misaligned angle is up to larger than 5°, and the rising scope increases. When the misaligned angle is further larger than 15°, the rotor-stator rubbing fault begins to appear, the one time fundamental frequency peak is sharply decreasing, the double fundamental frequency peak is sharply increasing. When the misaligned angle is further larger than 20°, the double fundamental frequency is close to the one time fundamental frequency and gradually beyond it. Conversely, as shown from the trend of double fundamental frequency, the fault of rotor system is gradually serious with the increase of the misaligned angle. The peaks of one and double fundamental frequency change abruptly, which indicates that the consistent increase leads to rubbing fault.
Fig. 5Time-domain graph, orbit diagram, frequency spectrogram and Poincare graph of rotor system with the change of misaligned angle
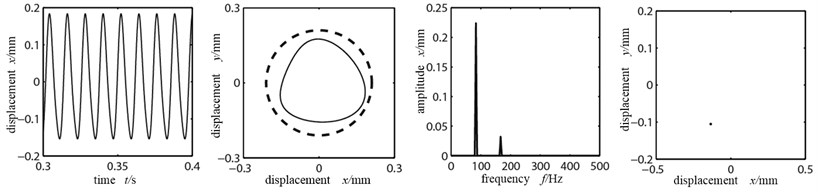
a) Misaligned angle 10°
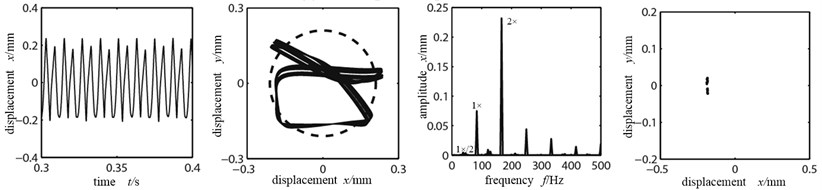
b) Misaligned angle 15°
c) Misaligned angle 18°
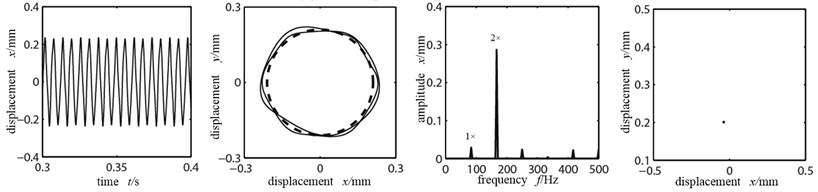
d) Misaligned angle 20°
Fig. 6One and double fundamental frequency peak graph with the change of misaligned angle
3.3. Influence of the friction coefficient
The rotor and stator are generally made of cast iron or brass or low-carbon steel, so the frictional factor between the rotor and stator is the kinetic friction coefficient among several materials. As shown in reference [13], the friction coefficient between brass and low-carbon steel is 0.44, between cast iron and brass is 0.3, between cast iron and cast iron is 0.15. When the rotational speed 4500 r/min, the rubbing stiffness 3×10⁷ N/m and the misaligned angle 15°, Fig. 7(a-c) is the time-domain graph, orbit diagram, frequency spectrogram and Poincare graph of rotor system at the left disk with the friction coefficient 0.44, 0.3, 0.15.
Fig. 7Time-domain graph, orbit diagram, frequency spectrogram and Poincare graph of rotor system with the change of friction coefficient
a) Friction coefficient 0.44
b) Friction coefficient 0.3
c) Friction coefficient 0.15
As shown in the orbit diagram in Fig. 7(a), when the friction coefficient is large, rubbing is not serious; the time-domain waveform is a regular period curve, the high and low peak is staggering, indicating that the system is in cycle 1 motion. However, with the existence of misaligned moment, the tangential force occupied the dominant position which is caused by the large friction coefficient, the axis orbit takes a “8” shape but not the ellipse shape, and the double frequency high order division appears, showing the misaligned fault characteristics. When the friction coefficient decreases to 0.3, in the time-domain appear clippings and the orbit transits from “8” shape to ellipse shape, showing significant rubbing fault characteristics. In frequency spectrogram the working frequency amplitude exceeds the double frequency and becomes the dominant frequency; as shown in the Poincare graph, the system is showing cycle 1 motion. When the friction coefficient further decreases to 0.15, the rubbing condition aggravates further and the axis orbit is in confusion, indicating integer cycle rubbing condition. Because the friction coefficient’s decrease, it caused the friction force of the rotor tangential direction decrease, compared with the Fig. 7(a) and (b), the frequency multiplication component is gradually wearing off except of the working frequency. Consequently the disk 1 enters into whole circle rubbing condition and the vibration response spectrum is of abundantly continuous spectrum; higher harmonic component has relatively more energy and the 1×/2, 1×/4 frequency division appears in frequency spectrogram. Combined with the Poincare graph we can see that many chaotic spots have appeared and this indicates that the system has entered into chaos.
3.4. Influence of the rubbing interval
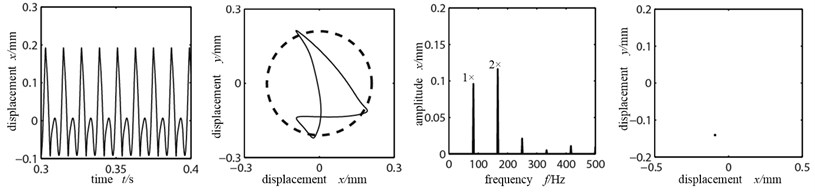
When the rubbing intervals are different, the dynamic response of the system is as shown in Fig. 8, in which (a)-c) are the time-domain graph, orbit diagram, frequency spectrogram and Poincare graph of rotor system at the left disk (node 11) with the rubbing interval being 250 μm, 200 μm, 150 μm. The other relevant parameter of the system: rotational speed 4500 r/min, the rubbing stiffness 3×10⁷ N/m, the friction coefficient 0.3, the misaligned angle 15°.
As shown in the orbit diagram in Fig. 8(a), the orbit diagram does not contact with the dotted line circle (where the stator sits), the rubbing fault between rotor and stator has not occurred. With the existence of misaligned moment, the axis orbit takes a concave shape but not ellipse shape; at the same time, the time-domain waveform is distorted slightly, double frequency peak is relatively large and the system mainly does working frequency motion. There is a single dot that appears in Poincare graph, which shows that the system is doing cycle 1 motion. Fig. 8(b) is the time-domain graph, orbit diagram, frequency spectrogram and Poincare graph in lateral vibration with the rubbing interval being 200 μm. At this time the decreased rubbing interval causes rubbing, with the rubbing force, the axis orbit’s concave shape more significant, from indent circle into “8” shape, frequency components are more abundant and the high frequency peak increases significantly with a 3 and 4 frequency multiplication; the time-domain waveform changes significantly, the high and low peaks appear alternatively, but there remains the periodic motion curve. As shown in the Poincare graph, the system remains in cycle 1 motion and there do not occur bifurcations. When rubbing interval decreases into 150 μm, rubbing becomes violent, the time-domain waveform and axis orbit are in confusion, which has changed into aperiodic motion curve in lateral vibration. Seeing from the Poincare graph and frequency spectrogram, there appear many dispersed dots. The axis orbit becomes complicated and the frequency spectrogram appears of continuous spectra, all indicating that the system is entering from cycle motion to chaotic motion via bifurcation.
As shown from above analysis, the less the rubbing interval is, the bigger influence of the rotor system caused by the rubbing becomes. Frequency spectrogram shows that the high frequency increases significantly; the axis orbit shows a concave shape after rubbing; frequency components are more abundant, the system is entering a chaotic motion gradually.
Fig. 8Time-domain graph, orbit diagram, frequency spectrogram and Poincare graph of rotor system with the change of rubbing interval
a) Rubbing interval 250 μm
b) Rubbing interval 200 μm
c) Rubbing interval 150 μm
3.5. Influence of the rotational speed
Rotational speed has a direct influence on the dynamic behavior of the rotor system. The amplitude-frequency three-dimensional waterfall figure changing with the rotational speed of the fault rotor system is as shown in Fig. 9. With the existence of misaligned fault, double frequency has presented large peak when rotational speed is low and rubbing does not appear. When rotational speed increases up to 1800 r/min, rubbing appears in rotor vibration signal, 1×/2 frequency division, 3 frequency multiplication, 4 frequency multiplication appear one after another. With the aggravation sequentially of rubbing, friction radian increasing, but fundamental frequency amplitude decreasing somewhat, higher harmonic amplitude is increasing obviously; if to keep it up, that will cause instability of the rotor system.
Fig. 10(a)-(c) is the time-domain graph, orbit diagram, frequency spectrogram and Poincare graph at the left disk with rotational speed being 1000 r/min, 2000 r/min, 5000 r/min. As shown from Fig. 10(a) with the rotational speed being low, at this time the rubbing fault between rotor and stator has not occurred. However with the existence of misaligned moment, axis orbit and time-domain graph is changing slightly, double frequency peak is high. With the further increase of rotational speed, the rubbing between rotor and stator occurs, there are many high-frequency exponents that occur in frequency spectrogram; in orbit diagram, there appears closed angle at the rubbing dot. At this time the Poincare section is still a single point and the system’s movement is cycle 1. When rotational speed goes up to 5000 r/min, which is far surpassing the first-order critical speed of the system, the phenomenon of rotor and stator is serious and both the time-domain waveform and orbit graph become chaos and distortion degree is becoming larger. Continuous spectrum appears in the frequency spectrogram. Many messy points appear in the Poincare section and the system goes into chaos.
Fig. 9The amplitude-frequency three-dimensional waterfall figure changing with the rotational speed
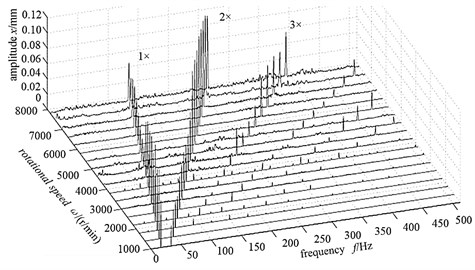
Fig. 10Time-domain graph, orbit diagram, frequency spectrogram and Poincare graph of rotor system with the change of rubbing stiffness
a) Rotational speed 1000 r/min
b) Rotational speed 2000 r/min
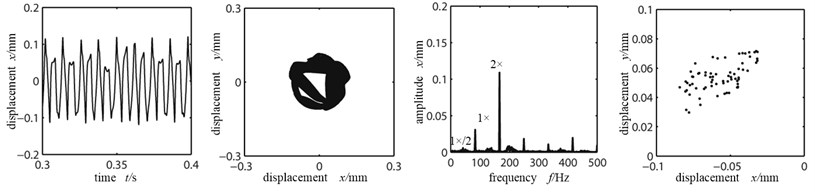
c) Rotational speed 5000 r/min
For a comprehensive study of the misaligned-rubbing coupling fault characteristic of the rotor system, based on the wavelet packet decomposition principle, fault data within four different rotational speeds (1000 r/min, 2000 r/min, 3000 r/min, 5000 r/min) adopt “db44” wavelet function to carry out four layers of wavelet decomposition [14]. Thus 16 independent and bandwidth bands are obtained. For the purpose of collecting the fault frequency band effectively, vibration data are sampled again and the sampling frequency is 1024 Hz, namely the analysis frequency is 1024 Hz, so bandwidth of every band frequency is 32 Hz.
From Fig. 10(b) and (c), basic axis orbit, time-domain waveform and frequency spectrogram can initially judge the fault degree of rotor system, but the fault features cannot be judged in detail. The dual-disk rotor bearing system was constructed for auxiliary experiments with the Bently RK-4 rotor test bench. B&K 3560B collection device was used to collect, filter, amplify and for A/D conversion of the vibration signal. The sampling frequency was 3.2 kHz. Test bench is as shown in Fig. 11.
Fig. 11The general view of the experimental rotor system
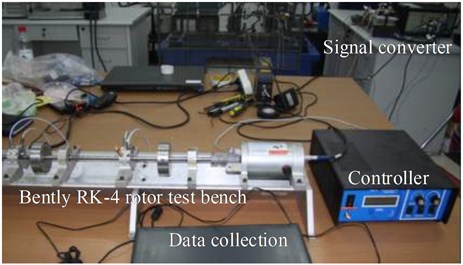
Fig. 12Signal band energy proportion figure with different rotational speeds
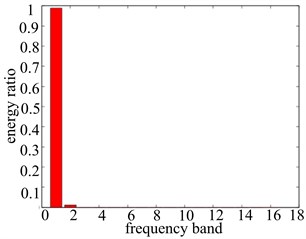
a) 1000 r/min
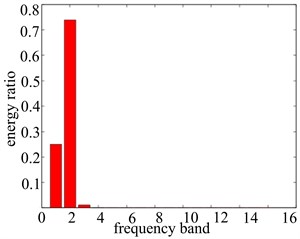
b) 2000 r/min
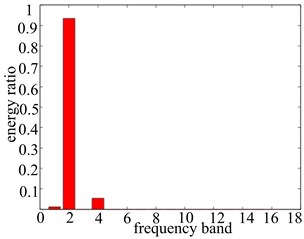
c) 3000 r/min
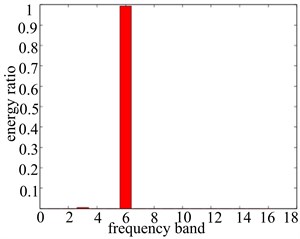
d) 5000 r/min
The energy proportion computation method of the wavelet packet decomposition is further applied, vibration data wavelet packet decomposition of each frequency band energy ratio are obtained, which is shown in Fig. 12, and the detailed ratio value of the frequency band energy is shown in Table 1. From Fig. 12 we can clearly see the vibration characteristics of the vibration signal in each frequency band and the distribution of energy ratio within different rotational speeds. Based on that, apart from the basic frequency (1X), all the vibration data in double frequency (2X) has the high energy distribution, which reveals obvious misaligned fault characteristics, and the double frequency is the fault characteristic frequency band (band 2, band 3, band 4, band 6 in four different rotational speeds, respectively). Through the comparison of the detailed frequency band energy ratio value of fault features, it can be accurately described and distinguished the severity of the system problems. When the rotational speed is a little lower as well as the existence of misaligned fault, fault frequency band has a certain amount of ratio value; the increase of rotational speed will cause the existence of rubbing fault of rotor system as well as the increasing rise of fault frequency band ratio value; when the rotational speed reaches 5000 r/min, the ratio value of fault frequency band goes up to 0.9927, which shows that the system has reached a very serious fault degree. On the whole the increase of the rotational speed causes the system fault degree becoming more serious.
Table 1Each band energy proportion numerical with different rotational speeds
1000 r/min | 2000 r/min | 3000 r/min | 5000 r/min | |
1 | 0.9878 | 0.2950 | 0.0123 | 1.803e-6 |
2 | 0.0122 | 0.6894 | 0.9338 | 1.357e-5 |
3 | 4.163e-9 | 0.0151 | 1.036e-4 | 0.0063 |
4 | 7.339e-11 | 4.649e-4 | 0.0537 | 1.255e-5 |
5 | 2.436e-12 | 1.149e-6 | 5.969e-6 | 2.366e-5 |
6 | 1.492e-12 | 4.957e-5 | 5.277e-7 | 0.9927 |
7 | 4.720e-13 | 2.811e-5 | 9.817e-5 | 1.075e-4 |
8 | 1.844e-12 | 1.956e-6 | 2.336e-6 | 1.996e-4 |
9 | 2.678e-12 | 2.872e-8 | 2.191e-6 | 1.406e-4 |
10 | 8.099e-15 | 1.327e-6 | 3.106e-6 | 8.466e-7 |
11 | 2.056e-15 | 1.109e-6 | 1.361e-7 | 8.361e-5 |
12 | 2.771e-15 | 4.475e-8 | 1.797e-8 | 5.956e-6 |
13 | 4.053e-15 | 6.026e-9 | 5.521e-8 | 1.477e-4 |
14 | 1.177e-14 | 1.144e-7 | 1.009e-7 | 2.067e-4 |
15 | 1.733e-15 | 9.392e-8 | 9.314e-8 | 8.924e-7 |
16 | 5.430e-16 | 5.327e-9 | 7.537e-9 | 4.125e-5 |
4. Conclusions
(1) For other given parameters, when the misaligned angle is less, the rubbing fault of the system doesn’t occur. Due to the influence of the coupling shimmy and the existence of the misaligned fault, then the higher order components of double frequency have revealed, but the axis orbit and time-domain waveform keep the same with healthy rotor motion condition. With the increase of misaligned angle, the higher order components increase rapidly and become the main frequency when surpassing the working frequency; the phenomenon of the disk rubbing occurs and the axis orbit becomes more chaos.
(2) When the stiffness decreases, the motion of the system is mainly of working frequency, the response of which is mainly controlled by the rubbing, and the axis orbit is typically the“8” shape among the single point local collision. When the rubbing stiffness increases, the axis orbit changes a little bigger, except the fraction time frequency component of the bigger amplitude out of the working condition, which shows that the rubbing is serious at this time.
(3) For other given parameters, when the friction coefficient decreases, the friction of the rotor tangential direction gradually goes down, and axis orbit of the rotor system gradually changes from“8” shape to ellipse shape, which makes the characteristic of the system rubbing fault more obvious and the frequency component more abundant.
(4) The less the rubbing interval is, the bigger influence of the rotor system caused by the rubbing becomes. Two and three times higher-order harmonics increase rapidly and the axis orbit becomes more and more chaos.
(5) Rotational speed has a great influence on the system vibration. The higher rotational speed is, the bigger vibration of the rotor system caused by the misalignment is, and the misaligned-rubbing coupling fault becomes more serious.
(6) After the analysis and study of the rotor system’s dynamic characteristics when it’s rubbing stiffness, misaligned angle, friction coefficient, rubbing interval and rotational speed differ, this paper finds that the misaligned-rubbing coupling fault is mainly featured by rubbing fault characteristic, which tends to be mistaken for single rubbing fault. While the “8” shape or “banana” shape within the typical rotor misaligned characteristics is not occurring. All of this brings huge difficulty for detecting fault. Apart from signal analysis methods such as harmonic decomposition, the following characteristic can be used as a basis in diagnosing misaligned-rubbing coupling fault: the double frequency of the rubbing fault caused by the misaligned bearing appears earlier and the peak grows rapidly.
References
-
Hu H. Y. Nonsmooth analysis of dynamics of a piecewise linear system. Chinese Journal of Theoretical and Applied Mechanics, Vol. 28, Issue 4, 1996, p. 483-488, (in Chinese).
-
Shaw S. W., Holmes P. J. A periodically forced piecewise linear oscillator. Journal of Sound and Vibration, Vol. 90, Issue 1, 1983, p. 29-155.
-
Shaw S. W. Forced vibration of a beam with one-sided amplitude constraint: theory and experiment. Journal of Sound and Vibration, Vol. 99, Issue 2, 1985, p. 199-212.
-
Chen Guo. Nonlinear dynamic study on a rotor-ball bearing system with unbalance-rubbing coupling fault. Journal of Vibration and Shock, Vol. 27, Issue 4, 2008, p. 43-48, (in Chinese).
-
Li Xingyang, Chen Guo. The dynamic analysis of rotor/ball bearings systems misalignment-rubbing coupling faults. Aircraft Design, Vol. 29, Issue 3, 2009, p. 71-80, (in Chinese).
-
Huang Zhiwei, Zhou Jianzhong, Zhang Yongchuan. Dynamic analysis on hydraulic generator rotors with coupling faults of misalignment and rub-impact. Proceedings of the CSEE, Vol. 30, Issue 3, 2010, p. 88-93, (in Chinese).
-
Han Qingkai, Yu Tao, Wang Deyou. Nonlinear Vibration Analysis and Diagnosis Methods of Fault Rotor System. Science Press, Beijing, 2010, (in Chinese).
-
Wen B. C., Wu X. H., Ding Q., et al. The Nonlinear Dynamics Theory and Experiment of Fault Rotating Machinery. Science Press, Beijing, 2004.
-
Bradford M. A., Yazdi N. Abdoli. Newmark-based method for the stability of columns. Elsevier Science Ltd., Vol. 71, Issue 6, 1999, p. 689-700.
-
Zhang Junhong, Ma Liang, Lin Jiewei. Dynamic analysis of flexible rotor-ball bearings system with unbalance-misalignment-rubbing coupling faults. Trans Tech Publications, Vol. 105-107, 2012, p. 448-453.
-
Liu Changli, Xie Pengru, Zhou Shaoping, et al. Dynamics characteristics of rotor with breathing crack using finite element method. Journal of Vibration, Measurement & Diagnosis, Vol. 31, Issue 2, 2011, p. 185-189, (in Chinese).
-
Wang Yan, Ma Jisheng, Zheng Haiqi, et al. Dynamic characteristics analysis of gear-bearing system with flexible rotor. Journal of Vibration, Measurement & Diagnosis, Vol. 32, Issue 1, 2012, p. 51-55, (in Chinese).
-
The Friction Coefficient Table of Materials [EB/OL].
-
http://wenku.baidu.com/view/4d176306cc175527072208ee.html.
-
Barzdaitis V., Bogdevicius M., Didziokas R. Diagnostics procedure for identification of rubs in rotor bearings. Journal of Vibroengineering, Vol. 12, Issue 4, 2010, p. 552-565.
About this article
This work was financially supported by the National Natural Science Foundation of China for Young Scientists (Grant No. 51105065), Exploration-Oriented Key Scientific and Technological Innovation Project from Ministry of Education of China (Grant No. N110203001).
