Abstract
Based on the computational fluid dynamics (CFD) method, this paper simulated the working conditions of hydraulic turbine under various sandy water resultant velocities. The vapor, liquid and solid phase flow fields and their characteristics on the turntable surface are numerically analyzed. The results show that the interactive wear regions mainly appeared on the regions with higher volume fractions of vapor phase and higher pressure gradients. When the resultant velocity increased, the interactive wears were heavier since the interactive wear regions increased along the edge of the hole in the tangential direction. The relationship curve between time and interactive wear weight loss was obtained in the test of four different resultant velocities. The results proved the theoretical analysis was reasonable. The overlay area of total pressure contours and vapor phase volume fraction contours were in good correlation with the shape of interactive wear surface in the test specimens.
1. Introduction
Large river sediment concentration, impacting flow passes by water current and sand grains, and erosive wear caused by impeller side are significant causes [1] for invalidation on the surface of flow passage components of water machine. Wu Jinghua conducted numerical value and experimental research on characteristics of for erosive wear of particles [2]; Fan Chunxue researched static pressure field of mixed flow water turbines and predicted occurrence time and occurrence position of cavitation on negative pressure surfaces at the exit of runner blade [3]; Wang Jiadao and Liu Shihan analyzed major effects of micro-particles in cavitation wear [4, 5]; Li Jian and Chen Cichang carried out experimental research on compound wear of hedging and cavitation [6, 7]; Wu Bo conducted numerical simulation on erosion actions of solid particles in the whole flow pass of slurry pump [8]; Ge Han researched formation mechanism of rainbow areas around cavitation pits [9]; Pang Youxia researched three-phase flow field for interactive wear between erosion and cavitation [10]. Erosion and cavitation coexist in actual operation working conditions of water turbines. At present, the interactive wear between erosion and cavitation has not been analyzed systematically and theoretically, and experimental researches on change of such parameter as resultant velocity, flow, and pressure of water current, towards interactive wear influences between erosion and cavitation, while the interactive wear mechanism between erosion and cavitation has been a hotspot explored and discussed by people all the time [11-16].
The turntable system is washed out in a certain incident angle with sandy water through imitating actual working conditions, and the flow field under interactive wear between erosion and cavitation is numerically calculated; influences for resultant velocity of sandy water on interactive wear between erosion and cavitation; and finally, numerical computation results are verified through interactive wear experiment between erosion and cavitation. The above research lays a foundation on wear mechanism for interactive wear between erosion and cavitation for flow passage components of fluid machinery.
2. Finite element analysis
2.1. Numerical computation model
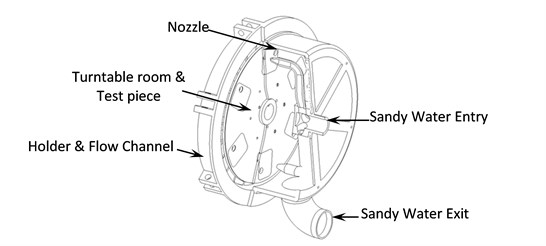
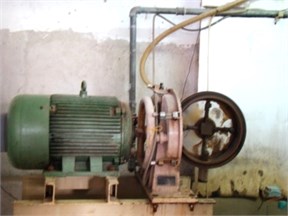
The finite element (FE) model, as shown in Fig. 1, was developed to imitate actual working conditions. Sandy water inflows from the entrance at certain speed and is sprayed the turntable with high-speed revolution through nozzles. There are pinholes on test pieces of the turntable, to form gas-liquid-solid three-phase fluid in the inner flow field of turntable system, which will generate interactive wear between erosion and cavitation.
Fig. 1Structural diagram of experimental device
Model parameters are as follows:
• Materials of test pieces: No. 45 steel;
• Pressure of turntable room: 0.1 MPa;
• Sand added amount: sand grain size ≤ 0.2 mm, 1 kg;
• Nozzle diameter 3 mm, 4 in all,
• Circle center diameter of cavitation hole,
• Resultant velocity.
Fig. 2Relations of three velocity vectors
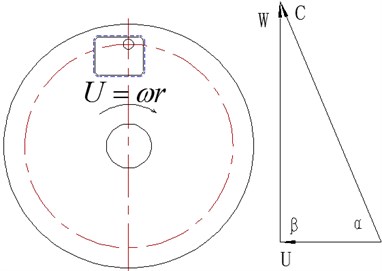
There are three kinds of velocity on rotating disc type wear testing devices, as shown in Fig. 2 ( indicates setting angle set as 90°; indicates nominal erosion angle), to meet the following relationship:
where, indicates the movement velocity that liquid material point impacts to relatively static turntable, namely resultant velocity; it is the synthesis of relative velocity and pulling speed; indicates the velocity for relative movement of liquid material point, namely relative velocity; indicates impeller peripheral velocity with instantaneous coincident point of liquid material point, namely pulling speed; and indicates nozzle flow, and there are four nozzles in the turntable cabin:
In the equation, indicates nominal erosion angle, namely the included angle between relative velocity and pulling speed 350º.
Table 1List of resultant velocity parameters
Parameters | 1 | 2 | 3 | 4 |
Rotation rate (r/min) | 1820 | 2070 | 2340 | 2600 |
Flow rate (m3/h) | 2.09 | 2.38 | 2.66 | 2.94 |
Resultant speed (m/s) | 35 | 40 | 45 | 50 |
2.2. Three-phase flow governing equation
Integrated cavitation model and mixed fluid two-phase flow model researched by SINGHAL are selected and used in the application of fluent software, and sand grain motional orbit is solved through sand grain acting force differential equation under integral Laplace coordinate system.
• Equation of continuity:
Hybrid flow phase can be expressed as below:
in which, is the Hamilton differential operator defined as ,
i, j, k: unit vectors in the directions of , , ,
: hybrid fluid density formed by cavitation phase and water current phase,
: velocity vector of hybrid fluid.
Gas phase, similarly, is expressed as:
where:
: the number of volume shares of gas phase in hybrid fluid,
: water current phase density,
: the number of cavitation within unit fluid volume,
: volume of single cavitation,
: gas phase density.
• Momentum equation:
In the equation:
: static pressure,
: dynamic viscosity for molecules of hybrid fluid,
: viscosity coefficient of turbulent flow.
• Balance equation of sand grain acting force ( direction):
In the equation:
: phase velocity of water current,
: sand grain velocity,
: sand grain density,
: sand grain diameter,
: relative Reynolds number,
: drag coefficient,
: acceleration of gravity in the direction,
: other acting forces in the direction: including added mass force, thermophoretic force, Brown force, and Saffman lift force.
2.3. Numerical computation method and boundary conditions
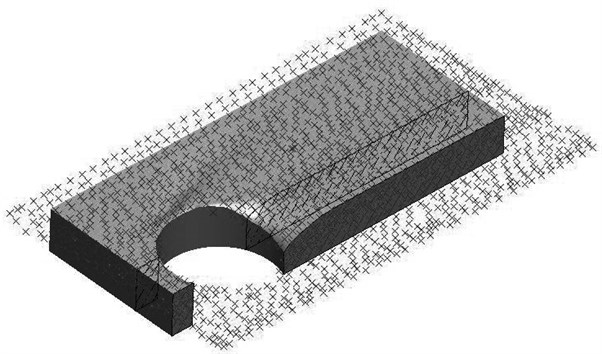
3D cavitation and erosion interactive flow field constant computation is adopted for the computation of gas-liquid-solid three-phase flow inside the turntable system. In order to imitate the movement of regional flow on the surface of turntable, multiple rotating coordinate system and given rotary speed and flow are adopted. The turntable system is divided into two fluid regions: i) the first region nearby the turntable adopted encrypted unstructured tetrahedron grids where 895,602 elements are employed, ii) other fluid region employed non-dense grids and thus larger element size with 1,329,182 elements in total, as shown in Fig. 3. Maximum cell squish and skewness are defined as 0.833 and 0.863 to meet the requirements of numerical computation.
Fig. 3Finite element model of the turntable system
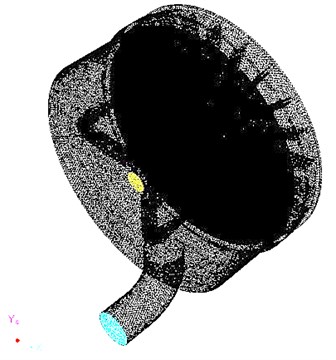
a) Global FE model
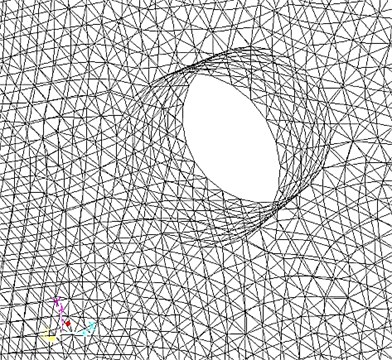
b) Local FE model
The interactive computation of complete gas-liquid cavitation model and sand grain discrete phase model is adopted at the computation of inner flow field, and Reynolds’ average NS equation is adopted as the governing equation. The turntable rotates at high speed and inner fluid is turbulent flow, so standard - turbulent flow model with wide application scope, economical, and appropriate precision is selected as the turbulent flow model, and standard wall function treatment is adopted for wall flow. There into, the coupling between velocity and pressure is realized with the use of SIMPLE algorithm. Second-order upwind scheme discretization is adopted for various variables and turbulence stickiness parameters. The cavitation volume fraction for the initial field of cavitation computation is given as 0, and the initial velocity of sand grains is equal to flow shooting velocity. And at the same time, in order to accelerate convergence and to control the renewal of filed variables computed within each iterative step with the use of segregated solvers, relaxation factors of each solving variable shall be decreased properly, so as to avoid fluctuation and divergence of residuals.
Velocity inlet and pressure outlet are adopted for boundary conditions of turntable system computation model, and boundary conditions conform to actual conditions. Non-slipping conditions are used in computed firm walls and wall-function method is adopted in near wall regions. Multiple resilience coefficients are adopted on sand grain wall surface, and at the same time wear for wall surface shall be considered. In the process of resolving, a sand grain dispersed phase shall be conducted with coupling computation after every 5-step continuous phase computation, and unstable sand grain tracking shall be conducted. Convergence residual precision shall be set as: continuity, , and direction velocity, , and gas-phase volume ratio are 0.001.
2.4. Numerical results
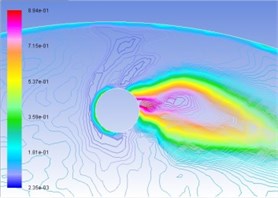
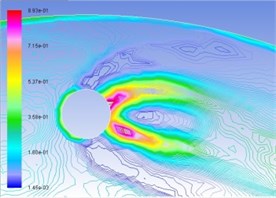
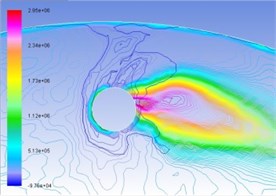
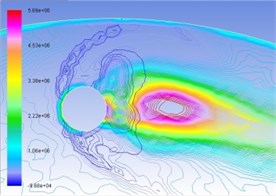
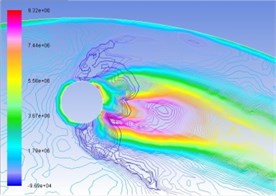
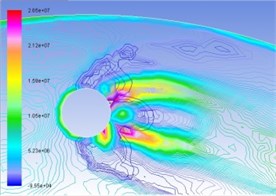
Figures 4(a), (b), (c), and (d) represent the total pressure contour map under the condition of interactive wear between erosion and cavitation when resultant velocity of sandy water is 35 m/s, 40 m/s, 45 m/s, and 50 m/s. Different colors show different pressure value, whose unit is Pa. Surface high-pressure region before turntable develops in the form of parabola around cavitation, and the maximum pressure is concentrated upon tangent line direction of cavitation hole along velocity. With the increase of resultant velocity, the numerical value of total pressure becomes larger and larger, as well as curvature of isopiestic line and pressure gradient.
Fig. 4Contours of total pressure on the turntable surface at various resultant velocities
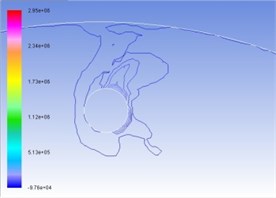
a) 35 m/s
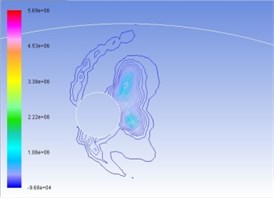
b) 40 m/s
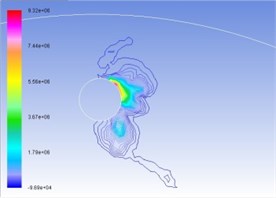
c) 45 m/s
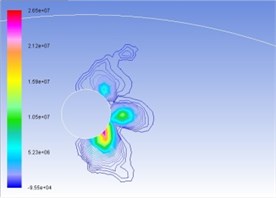
d) 50 m/s
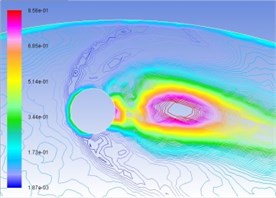
Similarly, Figs. 5(a), (b), (c), and (d) are respectively gas-phase volume distribution map under the condition of interactive wear between erosion and cavitation when resultant velocity of sandy water is 35 m/s, 40 m/s, 45 m/s, and 50 m/s. Different colors represent the volume ratio of gas phase to hybrid fluid in this position. It can be seen from the map that distribution pattern and pressure distribution are relatively complemented, and gas-phase region disputes in drop shape in cavitation holes along operating speed. The larger the velocity is, the larger the gas phase region will be, and the possibility for the form of cavitation is larger.
Fig. 5Distribution map of volume fraction of vapor phase on the turntable surface
a) 35 m/s
b) 40 m/s
c) 45 m/s
d) 50 m/s
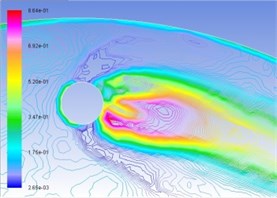
Fig. 6Superposition of total pressure and volume fraction of vapor phase on the turntable surface
a) 35 m/s
b) 40 m/s
c) 45 m/s
d) 50 m/s
In the same manner, Figs. 6(a), (b), (c), and (d) are respectively contour line stacking chart of total pressure and gas-phase volume ratio with numerical computation under the condition of interactive wear between erosion and cavitation when resultant velocity of sandy water is 35 m/s, 40 m/s, 45 m/s, and 50 m/s. It indicates that: (1) primary zone where interactive wear occurs can be confirmed basically, namely the cavitation region is large in gas-phase volume ratio and big in pressure gradient change; and (2) with the increase of resultant velocity, pressure gradient and gas phase volume ratio in the tangential direction increase obviously, superimposed region increases, and interactive wear degree becomes severe.
3. Experimental study
3.1. Experimental method
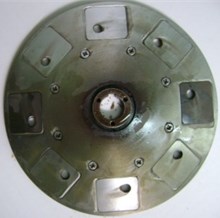
In order to research interactive wear between erosion and cavitation on flow passage components, test turntables and relevant systems are designed and manufactured [17], and structure diagram of test turntables and installation physical map of test pieces are shown in Fig. 1 and Fig. 7. In addition, the interactive wear time is 16 hours, and test sample observation and weighing shall be conducted every two hours. Weighing shall be conducted with the use of AB304-S electronic scale (with the precision of 0.1 mg), and weightlessness curve for the change of mass loss with time is drawn with the use of weight-loss method. In addition, macro and micro SEM surface appearance analysis shall be carried out after 16-hour interactive wear. Test dial drag to rotate by the motor with sand transported through the circulation pump water from the tank to dial rooms by the jet cover four nozzles with inner diameter of 3 mm directly at the specimen. Sandy water for tap water mixed with a certain quality of sand, controlled by screening a maximum particle size of sand particle size ≤ 0.2 mm, 1 kg in weight, and 1.37 g/L in density.
Fig. 7Specimen installed physical diagram
a)
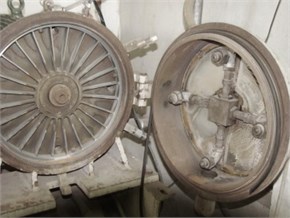
b)
c)
3.2. Experimental analysis
3.2.1. Weightlessness analysis
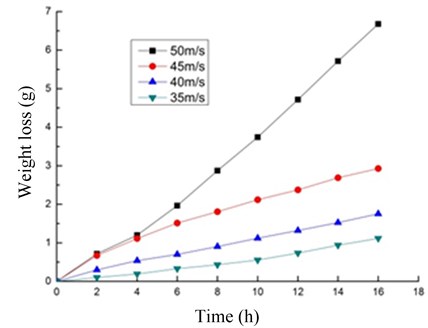
The relation curve between interactive wear time and mass loss is shown in Fig. 8 when sandy water is under different resultant velocity incidence conditions and No. 45 steel is conducted with 16-hour interactive wear between erosion and cavitation. The value of mass loss on the relation curve is the average value for mass loss of eight test pieces.
It can be seen from Fig. 7 that: with the increase of interactive wear time, interactive wear mass loss of test pieces increases in line under the condition of four resultant velocity incidence conditions when sandy current is respectively 35 m/s, 40 m/s, 45 m/s and 50 m/s. Thereinto, when the resultant velocity is 35 m/s, 40 m/s and 45 m/s, No. 45 steel is in the stable phase of wear all the time, and the curve rate of mass-loss curve is relatively small. When the resultant velocity is 50 m/s, No. 45 steel is in the induction period of wear in the first six hours, and the curve rate of mass-loss curve is relatively large and wear rate is unstable; six hours later, mass-loss cure rate increases and tends to be stable finally, transiting to the stable period of wear. At the same interactive wear time, the mass loss for test pieces of No. 45 steel increases with the increase for resultant velocity of sandy water current, namely the larger the resultant velocity is, the more severe the interactive wear degree will be. Mass-loss curve verifies numerical computation results reflected in (a), (b), (c), and (d) in Fig. 5.
Figure 9(a) is macro appearance photo of test pieces taken from the test bed operating for 16 hours when the resultant velocity of sandy water is 45 m/s. It can be seen from the figure that wear of test pieces mainly occurs around cavitation holes, including short-range plough cutting trace of erosion effects and pinhole pitting corrosion trace of cavitation effects, and wear traces are distributed along an included angle nearby cavitation holes. Test pieces’ macro appearance and numerical computation results are consistent with superimposed regions in Fig. 6c), and interactive wear regions are confirmed in theory and test.
Fig. 8Time and weight loss relationship of 45 steel at different resultant velocities
3.2.2. Test-piece surface appearance analysis
Figure 9(b) is the SEM photo of materials gained through wire-electrode cutting nearby cavitation holes of test pieces, whose amplification factor is 1000. It can be seen from the picture that surface of materials appears plough cutting and wave erosion appearance, with pits and globular white points. In interactive wear experiments between erosion and cavitation, water current and sand grain impact test pieces continuously, causing plough cutting and chipping on the surface of materials. And at the same time, bubbles generated nearby cavitation holes are impacted by jet flow on flow field or squeezed by pressures on the surface, inducing bubbles’ splitting, collapsing, and perishing, generating impact waves to impact material surfaces repeatedly, forming cavitation pits of pinhole shape, and arousing fatigue change of materials on the surface of test pieces. Furthermore, wear effects are amplified further through impact of sandy water.
Fig. 9Specimen: a) macro photo and b) microscopy photo at the resultant velocity of 45 m/s
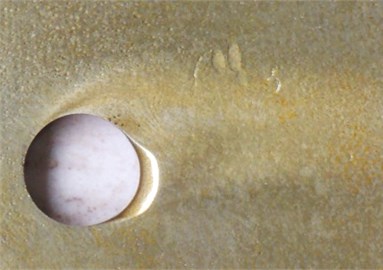
a)
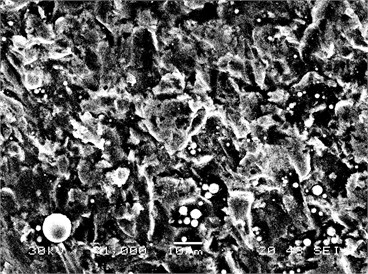
b)
In order to compare the results between numerical analysis and experimental study, the surface profile of the test piece was surveyed using the Coordinate Measuring Machine (CMM), as shown in Fig. 10 as red crosses. Meanwhile, the specimen shape was re-built using numerical simulation and plotted in Fig. 10. As a result, the comparison of the test piece surface profile between the computational and experimental analysis was conducted. Great agreement proved the efficiency and accuracy of the FE model, as well as the conclustions generated by the FE analysis.
Fig. 10Comparison of the surface profile between FE and experiment results
4. Conclusions
In the paper, the working conditions of hydraulic turbine under various sandy water resultant velocities were investigated based on CFD method. The flow field on the surface of turntables under the interactive effect of erosion and cavitation at various levels of resultant velocity of sandy water, e.g., 35 m/s, 40 m/s, 45 m/s, and 50 m/s, was analyzed. The main conclusions from the study are summarized as follows:
• The primary zone where interactive wear occurs can be confirmed. Namely the cavitation region is large in gas-phase volume ratio and big in pressure gradient change. With the increase of resultant velocity, pressure gradient and gas phase, the volume ratio in the tangential direction increase obviously, superimposed region increases, and interactive wear degree becomes severe, respectively.
• The interactive wear experiment between erosion and cavitation when the resultant velocity of sandy water is 35 m/s, 40 m/s, 45 m/s, and 50 m/s was conducted, gaining better understanding of the relation curve between interactive wear time and mass loss. Furthermore, mass loss may increase gradually with the increase of resultant velocity, namely the larger the resultant velocity is, the more severe the interactive wear degree will be, which was verified by the numerical results as well.
• Macro appearance on the surface of test pieces is basically corresponding to wear regions displayed in the contour line stacking chart for gas-phase volume ratio and total pressure of numerical computation.
The interactive wear between erosion and cavitation of flow passage components is complicated and requires more attention. Influences of change of turntable room’s pressure, sand grain size, sediment concentration, and erosion angle on the interactive wear between erosion and cavitation shall be further investigated.
References
-
Liu J., Xu H. Y., Qi L. H. The development of study on the abrasive rules and anti-abrasive technique of hydraulic machines. Journal of Hydroelectric Engr., Vol. 24, Issue 1, 2005, p. 113-117.
-
Wu J. H., Tang W. C., Xu H. X., Ben K. C. Numerical analysis of abrasive particles erosive wear. Lubrication Engineering, Vol. 33, Issue 9, 2008, p. 16-19.
-
Fan C. X., Han F. Q., Takashi K. Lump-sum analysis of internal flow in Francis turbine and resulted cavitation prediction. Journal of South China University of Technology (Natural Science Edition), Vol. 35, Issue 3, 2007, p. 71-76.
-
Wang J. D., Chen H. S., Qin L., Li Y. J., Chen D. R. The key role of micro-particles in cavitation erosion of hydraulic machyneries. Chinese Science Bulletin, Vol. 52, Issue 22, 2007, p. 2683-2687.
-
Liu S. H., Chen D. R. Mechanics mechanism of duplex steel cavitation damage. Acta Metallurgica Sinica, Vol. 45, Issue 5, 2009, p. 519-526.
-
Li J., Zhang Y. Z., Peng E. G., Qin X. P., Du S. M. Experimental study on cavitations erosion. Tribology, Vol. 26, Issue 2, 2006, p. 164-168.
-
Zhang T., Chen C. C., Guo Q. Experiment of damage of cavitation and silt abrasion for hydrofoil in silt-laden water flow. Transactions of the Chinese Society for Agricultural Machinery, Vol. 38, Issue 8, 2007, p. 31-37.
-
Wu B., Yan H. Z., Xu H. L., Tan Y. Q. Numerical simulation about erosion characteristics of solid particle in slurry pump. Journal of Central South University (Science and Technology), Vol. 43, Issue 1, 2012, p. 124-129.
-
Ge H., Du C., Chen H. S. Investigation on the formation of iridescent rings around cavitation erosion pit. Tribology, Vol. 30, Issue 4, 2010, p. 328-332.
-
Pang Y. X., Tang Y., Liang L., Zhu Z. M., Xu Y., Liu H. C., Li B. Flow field simulation and experimental research on interactive erosion and cavitation wears in three phases. Journal of Mechanical Engineering, Vol. 48, Issue 3, 2012, p. 115-120.
-
Zhang T., Chen C. C., Chen F. Research progress of cavitation, silt abrasion and their synergism. Drainage Irrigation Machinery, Vol. 24, Issue 4, 2006, p. 47-53.
-
Shengcai L. Cavitation enhancement of silt erosion – an envisaged micro model. Wear, Vol. 260, Issue 9, 2006, p. 1145-1150.
-
Yuan D. Q., Chen X. Y., Bai B., Cong X. Q. Research progress of cavitation and erosion in hydraulic machinery. Drainage and Irrigation Machinery, Vol. 27, Issue 4, 2009, p. 269-272.
-
Wang Y. J., Wei Q. C., Yau J. D. Interaction response of train loads moving over a two-span continuous beam. International Journal of Structural Stability and Dynamics, Vol. 13, Issue 1, 2013, p. 1350002.
-
Xia Y., Ma H. Y., Su D. Strain mode based damage assessment for plate like structures. Journal of Vibroengineering, Vol. 15, Issue 1, 2013, p. 55-63.
-
Singhai A. K., Athavale M. M., Li H. Y., Yu J. Mathematical basis and validation of the full cavitation model. ASME J. Fluids Eng., Vol. 124, Issue 3, 2002, p. 617-624.
-
Pang Y. X., Zhu Z. M., Liang L., Yu J. C. Development and application on wearing experimental device of multi-material interactive erosion and cavitations. Mechanical Science and Technology for Aerospace Engineering, Vol. 31, Issue 1, 2012, p. 1-3.
About this article
This study is partially funded by the National Natural Science Foundation of China (NSFC Project No.: 50975032), Hunan Ministry of Education (Project No.: 11C0116), and the Development Funding of the Key Disciplines in 12th Five-Year Plan of Hunan Province.
