Abstract
The need for an effective and efficient maintenance process increases with the level of complexity of modern rotating machinery. This paper introduces a methodology for transforming raw vibration signals into adequate inputs for machine learning classification algorithms in order to identify present faults in rotating machinery. It complements a previous study by the same authors, which covers the processing of vibrational signals by determining the optimal sampling frequency and using appropriate filters for the raw data. The first part of this study covers feature extraction using time and frequency-domain techniques and correlation matrices are plotted to determine which extracted features are significantly connected and what is the level of their correlation. The study continues with the use of Neighborhood Component Analysis (NCA) where weight factors of the features are calculated in terms of recognizing the present rotating machinery faults. Only the ones with the highest level of importance have been used as input for the classification algorithms. The MATLAB Add-in Classification Learner has been used for training and testing various classification algorithms. K-nearest neighbors classifier (KNN), Support vector machines (SVM), and Wide Neural Network (NN) showed the highest accuracy in distinguishing ten different fault conditions. For this case study, the MaFaulda vibration dataset has been used and ten operating conditions have been considered: normal, imbalance, horizontal misalignment, vertical misalignment, and three faults in the underhang bearing and the overhang bearing.
1. Introduction
Automated diagnostics of machinery is heavily researched by using the benefits of artificial intelligence for the identification and classification of possible faults. Condition-based machinery maintenance is based on highly sensitive parameters to fluctuations in its mechanical state, which correlates to the occurrence of faults. Vibration is regarded as the most effective indicator of the machine’s current condition, as it is highly sensitive to the early detection and progression of defects [1].
Most often, vibration signals measured on rotating machinery are in the time domain. These signals are composed of various responses originating from different sources within the machinery and often include background noise. Consequently, filtering, signal preprocessing, and feature extraction are necessary in order to obtain essential information. There are various methods for manual extraction of these features, whether statistical parameters in the time domain, spectral features in the frequency domain, or in the time-frequency domain. If a more complex system is to be analyzed, there can be a huge number of extracted features. If all of them were to be used as input to the classification algorithms, the computational time and costs would significantly increase. Not all features have the same level of importance when classifying various machinery faults. In order to optimize the feature extraction process, only those with the highest level of importance in terms of classifying various faults are chosen and used in further analysis. Once the features have been chosen, the next step involves the detection and identification of rotating machinery faults using classification algorithms which are based on supervised machine learning techniques. The algorithm categorizes measured data signals into distinct fault classes based on the features extracted from these signals.
Efficient and effective methods for extracting features are crucial for fault detection in rotating machinery. Numerous papers study various methods for feature extraction using time-domain, frequency-domain, and time-frequency domain analysis and showcasing their impact on the accuracy of the chosen classifying algorithm. The most common classifying algorithms include neural networks (NN), random forest (RF), k-nearest neighbors (KNN), and support vector machine (SVM). The papers [2-4] show that selection of features is essential to the success of intelligent fault diagnostics. T. Han et al. [2] extract three classes for model training: time-domain statistical features (TDF), frequency-domain statistical features (FDF), and multiple scale features (MCF) in order to present an extensive comparison. The authors also test the accuracy of RF, ANN, and SVM for classifying bearing and gear faults. H. Yang et al. [3] and Z. Kiral, and H. Karagülle [4] use time and frequency-domain analysis in order to perform fault diagnostics in rolling bearings. A. J. Hoffman and Van Der Merwe [5] use six time-domain and four frequency-domain features and test the classification algorithms with various combinations of features to perform manual feature extraction. On the other hand, J. Hang et al. [6] use empirical mode decomposition (EMD) to extract significant features from the signal. P. Chandrabhan et al. [7] compare Python and MATLAB results in civil structure health monitoring using time-domain and frequency-domain techniques. G. Dalpiaz et al. [8] use new methods based on time-frequency analysis and Time Synchronous Averaging (TSA) technique to demodulate the vibration signal for gear fault monitoring. D.J. Bordoloi, and R. Tiwari [9] use a SVM model to analyze the multi-fault classification of a gearbox.
Based on the existing state-of-the-art, one may conclude that various feature extraction methods lead to various diagnostic results and accuracy of the classification algorithm. In this paper, analyses using the Machinery Fault Database (MaFaulda) [10] are performed. MaFaulda is an open-source vibration data set containing ten different operating conditions measured on a SpectraQuest Machine Simulator [11] by researchers in papers [12,13]. It has been measured. In order to provide a complete overview of all the phases of preparing raw vibration signals for training and testing various classification algorithms, one has to include a detailed explanation of the used data set, which includes a visualization of the effects of the right sampling frequency, as well as filtering raw data, and organization of the measured data. The previous paper by the authors [14] covers the initial phases of the process of creating a supervised machine learning classification algorithm for fault identification and diagnostics of rotating machinery. It shows in detail the processing of vibrational signals and using statistical functions for feature extraction in the time-domain and performing TSA.
The novelty of this paper concentrates on developing a complete methodology of feature extraction as well as training and testing of various supervised machine learning algorithms for automated diagnostics of rotating machinery faults. Firstly, time and frequency-domain features are extracted from the previously filtered TSA signals [14]. Correlation matrices for the time-domain and frequency-domain features are generated to determine which extracted features are significantly connected. Furthermore, NCA is used to determine the weight factors of the extracted features based on their ability to distinguish 10 different operating states of the machine: normal, imbalance, vertical and horizontal misalignment, bearing with a faulty ball, bearing with a faulty cage, and bearing with a faulty outer race, for two bearings, the overhang and the underhang bearing, which are given in MaFaulda dataset. In the end, the features with the highest importance level regarding recognizing machinery faults are the input for training and testing with various classification algorithms. Finally, from the obtained results a conclusion can be drawn on which classifying algorithms achieve the highest accuracy when classifying various machinery faults.
2. Features extraction
Fault diagnostics process in rotating machinery uses measured vibrational signals in the time domain. As a result of the stochastic nature of these signals, using them in their raw form is inadequate in order to assess the machinery's current state. In this chapter time-domain and frequency-domain characteristics that reflect the core of the signal are extracted. As previously stated, the initial stages which cover choosing the sampling frequency, filters for raw data, and organization of the measured data are shown in detail in [14].
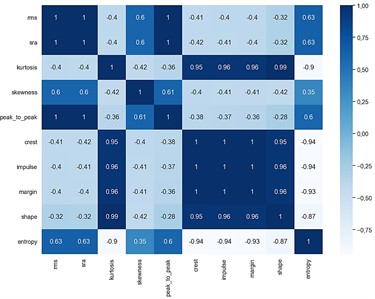
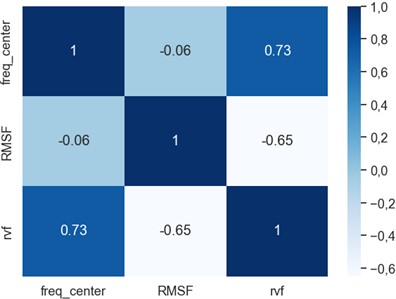
The monitoring the fluctuations of the state of the analyzed machinery cannot be performed using the vibrational signals in their raw nature due to their random character. Therefore, characteristics that define the statistical law and show the signal’s essence are prior extracted. In this paper, a total of 10 time-domain functions (Fig. 1(a) and 3 frequency-domain functions (Fig. 1(b)) are used to extract features from vibration signals. The time-domain functions include Root Mean Square (RMS), Kurtosis, Skewness, Peak-to-Peak Amplitude, Square Mean Rooted Absolute Amplitude (SRA), Crest Factor (CF), Impulse, Entropy, Margin, and Shape. The frequency domain functions include RMS frequency (RMSF), frequency center (FC), and root variance frequency (RVF). The MaFaulda data set consists of measured signals on the overhang and the underhang bearing, along the three axes, so there is a total of six signals. If the time and frequency-domain features were to be calculated for all six signals, there would be 60 time-domain and 18 frequency-domain features, or 78 features in total.
Fig. 1Correlation matrices for a), c) time domain features b), d) frequency domain features
a)
b)
c)
d)
A correlation matrix showing the correlations between all 78 features would not be clear to read and analyze. Therefore, firstly, the correlation matrices are plotted separately for time and frequency-domain features, but they do not show the correlations of the features for each axis in detail, Fig. 1. From the obtained correlation matrices, it can be seen that Entropy is not significantly connected to any other feature, so it is not considered in further analysis.
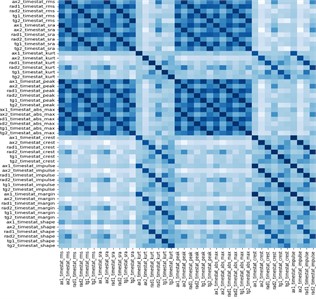
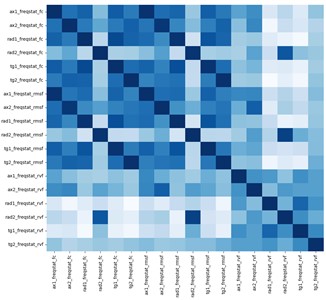
Considering all 6 input signals from MaFaulda along the 3 axes, two more correlation matrices are plotted, to determine the features with the highest significant correlation. Fig. 1 shows a total of 72 features, 54 time-domain (Fig. 1(c)), and 18 frequency-domain features (Fig. 1(d)).
In order to reduce the computational time, features with a correlation of 0.8 or higher are regarded as a single feature in further analysis. Consequently, this lowers the number of features from 72 to 60 time-domain features and frequency-domain features that are used as input to Neighborhood component analysis (NCA) in order to calculate the weight factors of the extracted features and to choose only the ones with the highest level of importance.
3. Features with the highest level of importance
Since not all time-domain features and frequency-domain features have an equal importance level regarding recognizing various machinery faults, only the most influential ones should be chosen and used as input for the classification algorithms.
Neighborhood component analysis (NCA) is used in this paper as a non-parametric technique for selecting extracted features with the highest weight factor to maximize the classification algorithms’ prediction accuracy. Only features with a weight factor equal to or higher than 1 are retained for further analysis and all the other features are omitted.
Fig. 2Applying NCA for obtaining features with the highest weight factor
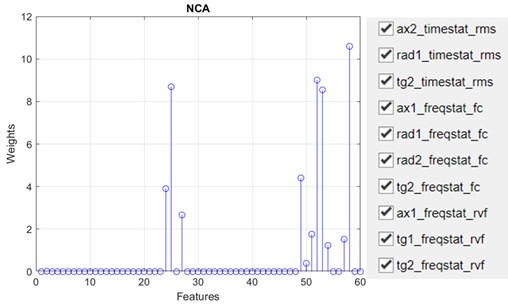
NCA for dimensionality reduction of features shows that only 10 extracted features have a weight factor equal to or higher than 1, and those are used as input for the training and testing processes of the classification algorithms in MATLAB. The features with the highest level of importance for classifying various rotating machinery faults include RMS along the three axes, FC along the axial and radial axis, and RVF along the axial and tangential axis, Fig. 2.
4. Classification algorithms
The previously mentioned 10 extracted features from Chapter 3 are used as input for the training process and testing process of various classification algorithms. The models to classify data using various classifiers based on supervised machine learning are trained and tested in MATLAB.
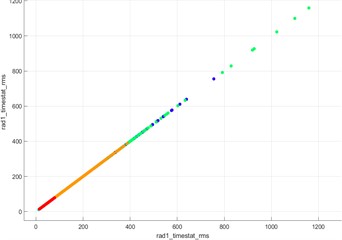
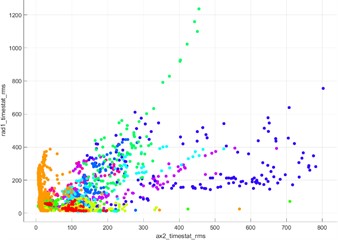
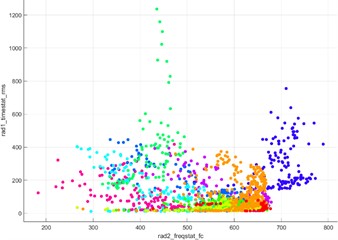
Before starting the training of the classification algorithms, scatter plots of the data are obtained in order to visualize the ability of the features to distinguish the 10 different fault conditions. Fig. 3 shows some of the scatter plots of the data expressed by three pairs of extracted features, and a legend of the 10 various operating conditions.
Fig. 3Scatter plots of data for three pairs of extracted features
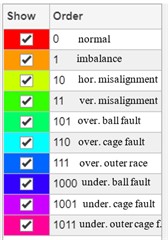
The extracted 10 features are used for training and testing various classifying learners based on supervised machine learning. 80 % of the data is used for training of the classifying learners and 20 % of the data is used for their testing. Confusion matrices of the algorithms with the highest accuracy to distinguish between the 10 operation conditions are shown in Fig. 4.
Fig. 4Confusion matrices for KNN and SVM algorithms
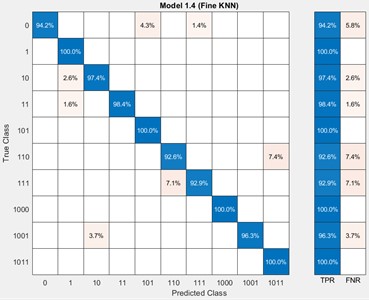
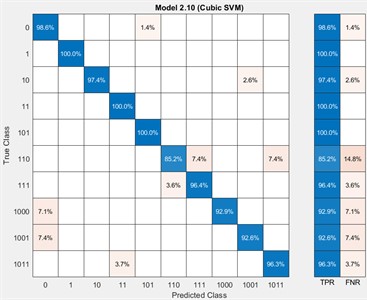
The classification learners that showed the highest accuracy in distinguishing between the analyzed 10 fault conditions are KNN with an accuracy of 97.2 %, SVM with an accuracy of 96.2 %, and Wide NN with an accuracy of 94.1 %. Finally, the three classifying models that showed the highest accuracy are used for generating a MATLAB code for fault detection of new data.
5. Conclusions
The maintenance process of rotating machinery plays a vital role in every production process, significantly impacting productivity and product quality. Consequently, automating the diagnostic phase, which involves monitoring the machine’s condition and detecting potential faults, is essential for efficient production facilities. The early phases of developing an automated condition monitoring system directly result in increasing the accuracy of the diagnostic system and decreasing the probability for occurrence of false alarms.
This study includes feature extraction using time and frequency-domain methods, and correlation matrices of the features to determine which ones are connected. Furthermore, it includes NCA in order to determine the features with the highest level of importance which would be used for further analysis. The features with the highest weight factor in terms of classifying various machinery faults include RMS along the three axes, FC along the axial and radial axis, and RVF along the axial and tangential axis. Finally, the features with the highest weight factor are used as input for the training and testing process of the supervised machine learning classification algorithms in the Classification Learner Add-In in MATLAB. The classification learners that showed the highest accuracy in distinguishing between the analyzed 10 fault conditions are KNN, SVM, and Wide NN.
Further steps in the research would include validation of the classification models using the generated MATLAB codes for the models a completely different dataset of signals measured on an experimental setup and real machinery system. This would show whether the classification system accurately recognizes various faults in a new system.
References
-
V. Wonk, Machinery Vibration – Measurement and Analysis. 1991.
-
T. Han, D. Jiang, Q. Zhao, L. Wang, and K. Yin, “Comparison of random forest, artificial neural networks and support vector machine for intelligent diagnosis of rotating machinery,” Transactions of the Institute of Measurement and Control, Vol. 40, No. 8, pp. 2681–2693, 2018.
-
H. Yang, J. Mathew, and L. Ma, “Vibration feature extraction techniques for fault diagnosis of rotating machinery: a literature survey,” in Asia-pacific vibration conference, Vol. 42460, pp. 801–807, 2003.
-
Z. Kiral and H. Karagülle, “Simulation and analysis of vibration signals generated by rolling element bearing with defects,” Tribology International, Vol. 36, No. 9, pp. 667–678, Sep. 2003, https://doi.org/10.1016/s0301-679x(03)00010-0
-
A. J. Hoffman and N. T. van der Merwe, “The application of neural networks to vibrational diagnostics for multiple fault conditions,” Computer Standards and Interfaces, Vol. 24, No. 2, pp. 139–149, Jun. 2002, https://doi.org/10.1016/s0920-5489(02)00014-4
-
J. Hang, J. Zhang, and M. Cheng, “Application of multi-class fuzzy support vector machine classifier for fault diagnosis of wind turbine,” Fuzzy Sets and Systems, Vol. 297, pp. 128–140, Aug. 2016, https://doi.org/10.1016/j.fss.2015.07.005
-
C. Patel, N. Garg, S. Panigrahi, and V. Kumar, “Signal processing with MATLAB and Python for real-life structural health monitoring: A comparative implementation for post-processing,” Research Square Platform LLC, Jul. 2022, https://doi.org/10.21203/rs.3.rs-1856394/v1
-
G. Dalpiaz, A. Rivola, and R. Rubini, “Gear fault monitoring: comparison of vibration analysis techniques,” in Proceedings of the 3rd International Conference on Acoustical and Vibratory Surveillance Methods and Diagnostic Techniques, Vol. 13, pp. 623–637, 1998.
-
D. J. Bordoloi and R. Tiwari, “Support vector machine based optimization of multi-fault classification of gears with evolutionary algorithms from time-frequency vibration data,” Measurement, Vol. 55, pp. 1–14, Sep. 2014, https://doi.org/10.1016/j.measurement.2014.04.024
-
“MaFaulda – Machinery Fault Database.”. http://www02.smt.ufrj.br/~offshore/mfs/page_01.html
-
“SpectraQuest.”. http://www.http//spectraquest.com/
-
M. A. Marins, F. M. L. Ribeiro, S. L. Netto, and E. A. B. Da Silva, “Improved similarity-based modeling for the classification of rotating-machine failures,” Journal of the Franklin Institute, Vol. 355, No. 4, pp. 1913–1930, Mar. 2018, https://doi.org/10.1016/j.jfranklin.2017.07.038
-
D. P. Viana et al., “The influence of feature vector on the classification of mechanical faults using neural networks,” in IEEE 7th Latin American Symposium on Circuits and Systems, pp. 115–118, 2016.
-
A. Ignjatovska, Z. Petreski, S. Domazetovska, and D. Pecioski, “Time-domain analysis of vibration signals of rotating machinery with defects under varying load conditions,” in International Conference on Control, Automation and Diagnosis, pp. 1–6, 2023.
About this article

The authors have not disclosed any funding.
The datasets generated during and/or analyzed during the current study are available from the corresponding author on reasonable request.
The authors declare that they have no conflict of interest.
