Abstract
Plant availability and reliability can be improved through a robust condition monitoring and fault diagnosis model to predict the current status (healthy or faulty) of any machines and critical assets. The model can then predict the exact fault for the faulty asset so that remedial maintenance can be carried out in a planned plant outage. Nowadays, the artificial intelligence (AI)-based machine learning (ML) model seems to be current trend to meet these requirements. Hence, the paper is also proposing such vibration-based faults diagnosis ML model through an experimental rotating rig. Here, the 2-Steps approach is used with the ML model to easy the industrial operation and maintenance process. The Step-1 provides the information about the asset health status such as healthy or faulty. The Step-2 then identifies the exact nature of fault to aid the decision making for the fault rectification and maintenance activities to avoid the risk of failure and enhance the reliability.
Highlights
- Developed a 2-steps machine learning (ML) model for the fault diagnosis in rotating machines.
- Step-1 identifies whether the machine is healthy or faulty.
- Step-2 identifies the exact nature of the fault to aid the condition-based maintenance process.
1. Introduction
The maintenance approaches implemented in industry have been changing over time. The development of new techniques and technologies, along to the increased concerns on safety and reliability during operation, have determined the new trends.
Predictive maintenance has gained an important recognition as it allows to detect the machines’ faults before a major breakdown or catastrophic event occurs, contributing to the improvement of the processes. These techniques, such as vibration analysis, oil analysis, acoustic analysis, among others, are based on information that indicates deterioration. This characteristic not only allows to achieve its primary concern, which is the failure prevention, buy it also supports an efficient operation. An efficient operation is translated into improved safety, the products quality, reliability and availability, as well costs [1].
Traditional time-based or preventive maintenance approach is still widely used in industry [2]. Regardless the beneficial possibilities provided by predictive maintenance implementation, it is typically reserved for most critical equipment, as these techniques tend to be related to a costly implementation. However, new advances, such as the ones in wireless technology, allow to have a continuous monitoring, without frequency-based inspections, at a lower cost [3].
While collecting data through condition monitoring tasks provides knowledge on the asset condition, it does not modify the actual state of the equipment. It is required a well defined process that provides clear indication if further action is required. The quality of the collected data has vital impact on the decision making process. Baidya and Ghosh [4] highlight on their proposed model for a predictive maintenance system. The importance of the correlation between the changes in the physical condition of the asset and the appropriate maintenance actions defined to take, which should aim to maximise the service life of the equipment, always having the risk of failure under control.
Traore et al. [5] proposed model for efficient predictive maintenance which integrates several tools on its development such as failure mode effect and criticality analysis (FMECA) and fault tree analysis (FTA), along with supervision and prognosis architecture. The authors remark the importance of data driven approaches to assess dynamical systems, as their behaviour evolves over time, being difficult to represent them by mathematical models.
Machine learning (ML) techniques for the pattern recognition are found among the data driven approaches. These techniques have been widely developed over the last few years, showing promising results on their industrial application in several areas. Many research studies are found in the literature for the fault diagnosis in machines. Therefore, the smart fault diagnosis models using the industrial internet of things (IIoT) seems to be a possible future avenue for fault diagnosis in machines without the involvement of the engineering judgments and experience.
Civerchia et al. [6] have demonstrated that a real industrial application for advanced predictive maintenance under IIoT concept is feasible. They implemented a IIoT based solution with smart sensing devices in an electricity plant, developed. Among the benefits presented for the usage of sensors to monitor equipment operation is the data collection to perform predictive maintenance, the improvement on the maintainability and reduction of risks, as well the possibility to avoid delays related to human interactions.
In the conceptual framework for the development of a predictive maintenance application within the Industry 4.0 proposed by Chukwuekwe et al. [7], it is highlighted how predictive maintenance heavily relies on the utilised algorithm and its ability to define the patterns from data collected by sensors in real time. Consequently, the quality of the outcomes will depend firstly on the quality of the collected data, and secondly on having a reliable model with the capability of being consistent: equipment to equipment in a fleet of similar machines, as well time to time and place to place.
In this paper, it is presented a fault detection model for rotating machinery, using a supervised ML technique and experimental vibration data. The well- known vibration-based parameters [8], [9] are used as the inputs in the development of the ML model. This model performs a pattern recognition for the machine condition in 2-Steps. Step-1 identifies if the machines is healthy or faulty, and then it performs the fault diagnosis over the samples detected as faulty in the Step-2 approach. The proposed 2-Steps approach is inline with the industrial requirements to quickly know the machine status – healthy or faulty and then doing further diagnosis to know the exact fault if the machine is faulty. This is likely to make the decision making process easy in the process of the condition-based maintenance to optimise the availability and improve the reliability.
The paper presents the proposed methodology and its demonstration through the experimental rotating rig with healthy and different fault conditions.
2. Proposed 2-steps approach
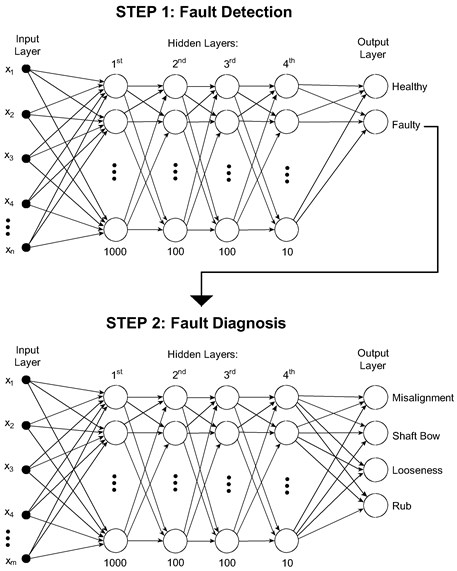
Artificial neural network (ANN) approach is used to develop the robust and reliable VFD-ML model for the fault diagnosis in rotating machines. In this study, a multi-layer perceptron (MLP) network structure is used to develop a 2-Steps diagnosis model. The proposed MLP ANN for this 2-steps approach is shown in Fig. 1. The Step-1 identifies whether the sets of data are belong to heathy or faulty state of machine and then Step-2 further identifies the exact nature of the machine fault. The ANN architectures used in Step-1 and Step-2 are identical.
The architecture implemented in this model is initially set by iterations. During the iteration process, different parameters were adjusted, namely the type of mathematical functions as well the number of layers and neurons at each layer. The resultant feedforward network is seen in Fig. 1. It has 4 hidden layers, 1 to 4, which have 1000, 100, 100 and 10 neurons, respectively. In addition to the hidden layers, the input layer and the output layer are shown. The output layer shows the possible classes at each step of the proposed method.
The selected functions are functions typically used in pattern recognition neural networks. At hidden neurons, the transfer function is the hyperbolic tangent sigmoid [10]; at output neurons the transfer function is sofmax [11]; scaled conjugate gradient backpropagation is set as the training function; and the performance function is cross-entropy from Matlab.
In Step-1, the input layer moves forward along the hidden layers, finishing with the delivery of the result from the decision layer, which has 2 possible classes – heathy and faulty conditions. Similarly in Step-2, only data diagnosed as faulty in Step-1 are used, relating 4 faulty conditions as possible outputs, namely misalignment, shaft bow, looseness and rub.
Fig. 1Schematic of 2-steps approach using MLP within ANN method
3. Experimental rig
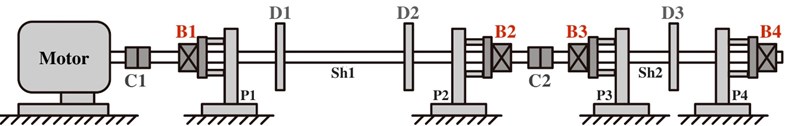
The schematic of the laboratory scaled rig is shown in Fig. 2. It consists of 2 shafts supported through 4 ball bearings. Both, long shaft (Sh1) and short one (Sh2) of length of 1.0 m and 0.5 m respectively, are joined by a rigid coupling C2. The long shaft Sh1 is connected to an electric motor by a flexible coupling, C1. Two discs D1 and D2, are mounted on the long shaft Sh1 and one disc, D3, on the short shaft Sh2. The 4 bearings, B1 to B4, are mounted on the flexible pedestals P1 to P4, respectively [12].
Fig. 2Schematic of the experimental rig
4. Experimental vibration data
The available measured vibration data [13] from the rig at the steady speed, 1800 RPM (30 Hz) are used in the study. Healthy and 4 different rotor faulty conditions are used. The measured vibration data are made of the simultaneously measured acceleration responses at the 4 bearing housings (one per bearing) at a sampling rate of 10 samples per second. The number of samples per rotor condition are summarised in Table 1.
The healthy condition samples are subject to small residual unbalance and residual misalignment as expected for any healthy machine. Hence, the measured vibration velocity spectra at all bearings are also showing prominent peak at 1x (speed synchronous vibration due residual unbalance) with a small peak at 2x due to the residual misalignment. This is common feature for any industrial rotating machine. However, the typical experimental amplitude velocity spectra for the faulty rotor conditions (with added faults) at the machine speed of 1800 RPM (30 Hz) are shown in Fig. 3. The spectra show the presence of the peak at 1x and higher harmonics with different amplitudes for the different fault conditions. The misalignment, Fig. 3(a), is showing 1x and 2x peaks. The 1x and 2x peaks are increased significantly for the shaft bow condition, Fig. 3(b). In case of the looseness, Fig. 3(c) the significant increase in 1x and 3x (odd harmonic) peaks is observed, however higher harmonics are showing increasing trend in case of shaft rub, Fig. 3(d).
Table 1Experimental data samples at 1800 RPM
Rotor condition | Samples (runs) |
Healthy (residual unbalance and residual misalignment) | 66 |
Misalignment | 109 |
Shaft bow | 202 |
Looseness in bearing pedestal | 190 |
Rotor rub | 112 |
Total samples | 679 |
Fig. 3Typical velocity vibration spectra at Bearing 3 (B3) for the experimental faulty conditions
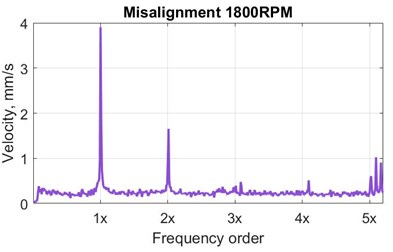
a) Misalignment
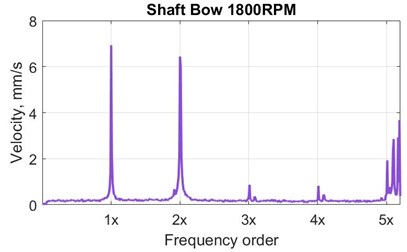
b) Shaft bow
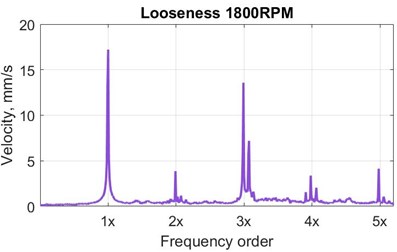
c) Looseness in pedestal
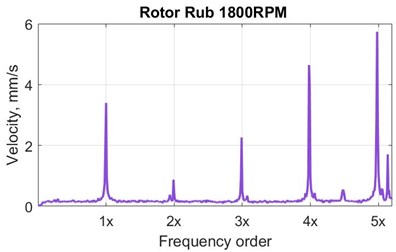
d) Rotor rub
5. Data preparation
Earlier study [14] has optimised the vibration parameters to be used in the ML model for the reliable and accurate machine health diagnosis. These parameters are the combinations of time and frequency domain parameters of the measured vibration responses. They are acceleration root mean square (RMS), acceleration kurtosis (), velocity (1x, 2x, 3x components) and the velocity spectrum energy () to include effects of subharmonics and any other frequency components due to different faults. Spectrum energy includes the range from 0.2 times to 5 times operational speed.
The input databank, , is created as per Eq. (1). The elements of are shown in Eq. (2). Similarly, the databanks for the faulty conditions; misalignment (), shaft bow (), looseness () and rotor rub () are constructed. These elements or parameters are calculated from the vibration data collected simultaneously at the 4 bearing locations. As a result, a vector made by 24 elements (6 parameters per bearing x 4 bearings) represents one sample as per Table 1. Thus, is the value calculated at the bearing B1, is the RMS value at B2, and so on for the -sample. Similarly, the subscripts, B3 and B4 represents the bearings 3 and 4 respectively of the rig:
where:
6. Implementation of the 2-steps approach
The proposed 2-Steps approach discussed in Section 2 is implemented here. The samples (runs) listed in Table 1 are grouped into 3 datasets for the ML model training, validation and then testing. A set of 70 % of the samples (runs) from each machine condition at 1800 RPM are used for training the network, modifying the weights according to the learning rule. 15 % of the samples are further used for validation, which is conducted by verifying the trained network with these samples until their classification error reaches a desired point of minimum error, giving the order to stop the training process. At this point, the weights are the optimal for the network and, the last group of unknown remaining data, 15 %, is then tested, providing the generalisation of the network.
The data 70 %-15 %-15 % (training-validation-testing) are applied to both Step-1 and Step-2 models as per Fig. 1. The model performance is calculated as in Eq. (3). The error means that the model diagnosis is not accurate at a few occasions:
7. Results
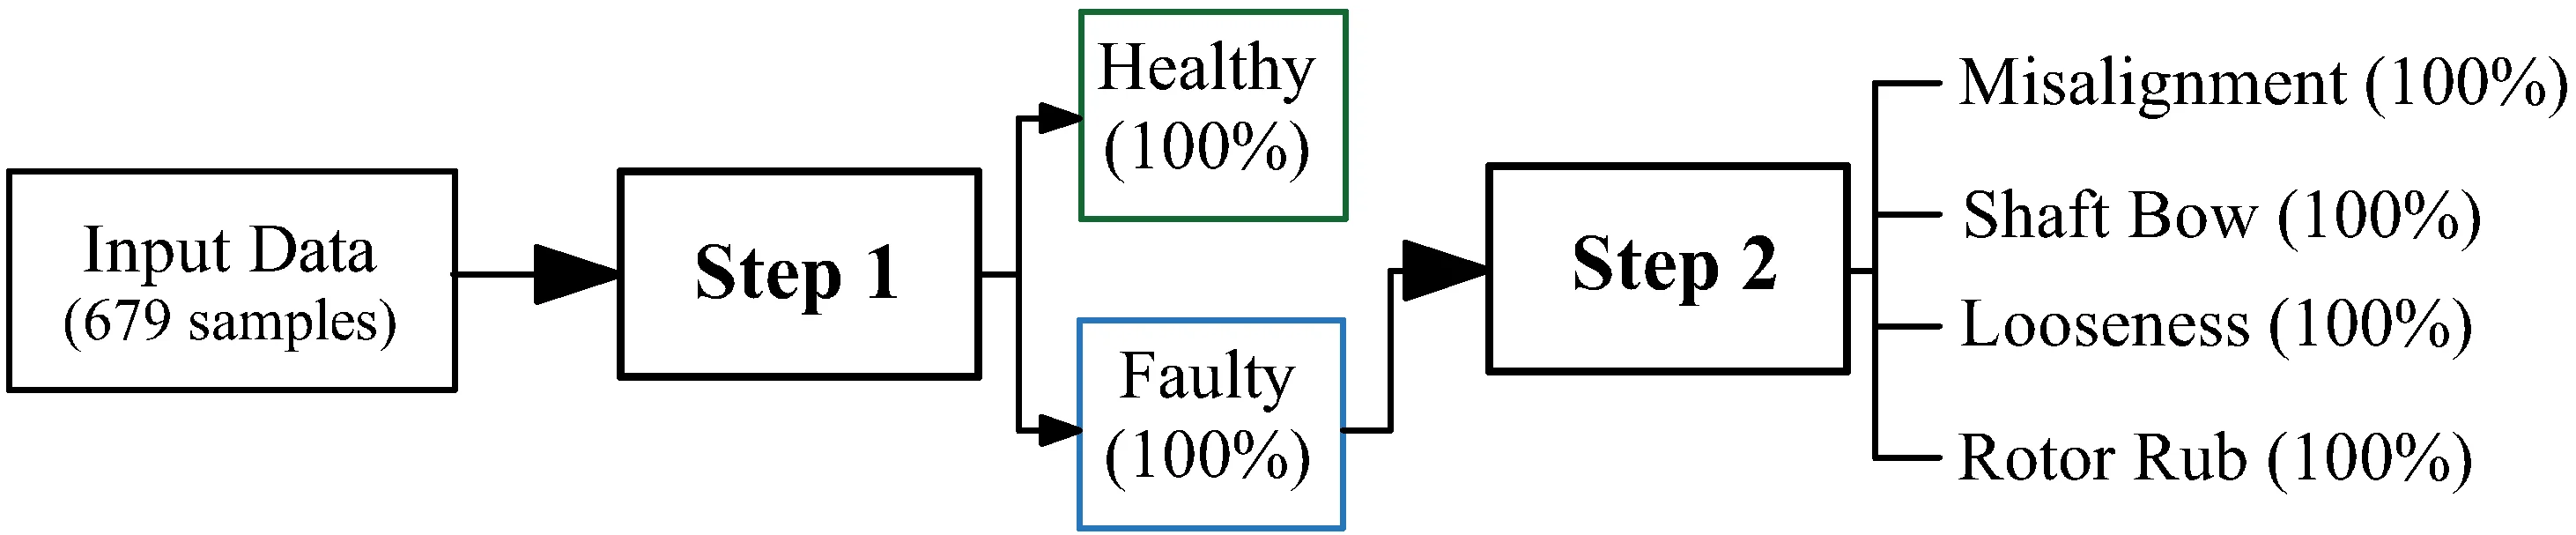
The overall performance in all stages (training, validation and testing) for both Step-1 and Step-2 models are observed to be 100 %. Therefore, the diagnosis by the proposed 2-Steps approach are going to 100 %. The overall diagnoses by the proposed 2-Steps smart fault detection model are summarised in Tables 2-3. Table 2 contains the overall results in Step-1 while Table 3 contains the overall results in Step-2. The results also confirm that the optimised parameters earlier suggested [14] are useful for the 2-Steps approach. These parameters should be used for any rotating machines. The results are definitely encouraging for industrial applications to know the health status of the assets immediately, which is going to be useful for operation and maintenance for any industries.
Table 2Step-1, diagnosis performance (%)
Diagnosis | Actual | |
Healthy | Faulty | |
Healthy | 100.0 | 0.0 |
Faulty | 0.0 | 100.0 |
Table 3Step-2, diagnosis performance (%) for faulty conditions
Diagnosis | Actual | |||
Misalignment | Bow | Looseness | Rub | |
Misalignment | 100.0 | 0.0 | 0.0 | 0.0 |
Bow | 0.0 | 100.0 | 0.0 | 0.0 |
Looseness | 0.0 | 0.0 | 100.0 | 0.0 |
Rub | 0.0 | 0.0 | 0.0 | 100.0 |
Fig. 4Step-1 performance (%) of the smart fault detection model in separating heathy and faulty conditions
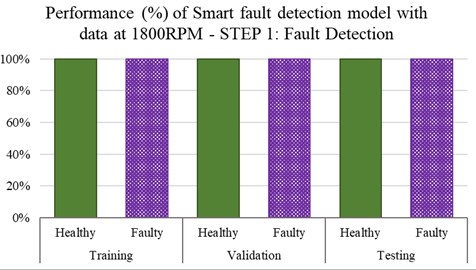
Fig. 5Step-2 performance (%) of smart fault detection model in fault diagnosis
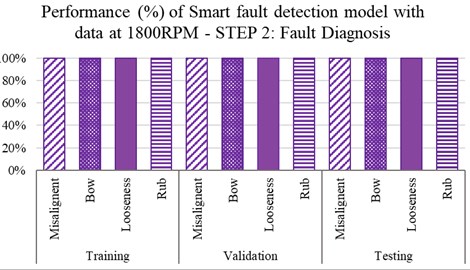
8. Concluding remarks
The current study has utilised vibration parameters that are commonly used in industries for the faults diagnosis in rotating machines. Therefore, the proposed model is not using any complex signal processing. However, the smart diagnosis model is proposed such that it is useful for industrial applications. The Step-1 confirms whether the measurement from the machine indicates about the status of the machine, healthy or faulty. If it is heathy then there is no further action is needed. However, if it is faulty, then the Step-2 provides the nature of the defects. This approach is definitely going to add new dimension in the condition based maintenance practice to enhance the machine availability and reliability. The proposed 2-Steps approach is demonstrated through in a laboratory scaled experimental rotating rig with healthy and faulty conditions.
References
-
S. Selcuk, “Predictive maintenance, its implementation and latest trends,” Proceedings of the Institution of Mechanical Engineers, Part B: Journal of Engineering Manufacture, Vol. 231, No. 9, pp. 1670–1679, Jan. 2016, https://doi.org/10.1177/0954405415601640
-
H. M. Hashemian, “State-of-the-art predictive maintenance techniques,” IEEE Transactions on Instrumentation and Measurement, Vol. 60, No. 1, pp. 226–236, Jan. 2011, https://doi.org/10.1109/tim.2010.2047662
-
X. Zhou, L. Xi, and J. Lee, “Reliability-centered predictive maintenance scheduling for a continuously monitored system subject to degradation,” Reliability Engineering & System Safety, Vol. 92, No. 4, pp. 530–534, Apr. 2007, https://doi.org/10.1016/j.ress.2006.01.006
-
R. Baidya and S. K. Ghosh, “Model for a predictive maintenance system effectiveness using the analytical hierarchy process as analytical tool,” IFAC-PapersOnLine, Vol. 48, No. 3, pp. 1463–1468, 2015, https://doi.org/10.1016/j.ifacol.2015.06.293
-
M. Traore, A. Chammas, and E. Duviella, “Supervision and prognosis architecture based on dynamical classification method for the predictive maintenance of dynamical evolving systems,” Reliability Engineering & System Safety, Vol. 136, pp. 120–131, Apr. 2015, https://doi.org/10.1016/j.ress.2014.12.005
-
F. Civerchia, S. Bocchino, C. Salvadori, E. Rossi, L. Maggiani, and M. Petracca, “Industrial internet of things monitoring solution for advanced predictive maintenance applications,” Journal of Industrial Information Integration, Vol. 7, pp. 4–12, Sep. 2017, https://doi.org/10.1016/j.jii.2017.02.003
-
D. O. Chukwuekwe, P. Schjølberg, H. Rødseth, and A. Stuber, “Reliable, robust and resilient systems: towards development of a predictive maintenance concept within the industry 4.0 environment,” in EFNMS Euro maintenance 2016 Conference, 2016, Vol. 24, pp. 10.
-
J. Kumar Sinha, Vibration Analysis, Instruments, and Signal Processing, CRC Press, Dec. 2014, https://doi.org/10.1201/b17938
-
J. K. Sinha, Industrial Approaches in Vibration-Based Condition Monitoring, CRC Press, Jan. 2020, https://doi.org/10.1201/9781315147222
-
T. P. Vogl, J. K. Mangis, A. K. Rigler, W. T. Zink, and D. L. Alkon, “Accelerating the convergence of the back-propagation method,” Biological Cybernetics, Vol. 59, No. 4–5, pp. 257–263, Sep. 1988, https://doi.org/10.1007/bf00332914
-
C. M. Bishop, Pattern Recognition and Machine Learning, Springer, 2006.
-
A. Yunusa-Kaltungo and J. K. Sinha, “Combined bispectrum and trispectrum for faults diagnosis in rotating machines,” Proceedings of the Institution of Mechanical Engineers, Part O: Journal of Risk and Reliability, Vol. 228, No. 4, pp. 419–428, Feb. 2014, https://doi.org/10.1177/1748006x14524547
-
A. D. Nembhard and J. K. Sinha, “Unified multi-speed analysis (UMA) for the condition monitoring of aero-engines,” Mechanical Systems and Signal Processing, Vol. 64–65, pp. 84–99, Dec. 2015, https://doi.org/10.1016/j.ymssp.2015.04.027
-
N. E. Sepulveda and J. Sinha, “Parameter optimisation in the vibration-based machine learning model for accurate and reliable faults diagnosis in rotating machines,” Machines, Vol. 8, No. 4, p. 66, Oct. 2020, https://doi.org/10.3390/machines8040066
Cited by
About this article

Natalia Fernanda Espinoza Sepúlveda acknowledges the support by CONICYT (Comisión Nacional de Investigación Científica y Tecnológica/Chilean National Commission for Scientific and Technological Research) “Becas Chile” Doctorate’s Fellowship programme; Grant No. 72190062 for her PhD study.
