Abstract
In a multi-stage gear transmission system, the motion state of the system will change with the excitation frequency, and the frequency characteristics will also change accordingly. If this change is not taken into account, there is often a great deviation in identifying and judging system faults according to unified standards, especially when the system has such early undetectable fault as crack. In this paper, the dimensionless differential equations of motion of multistage gear transmission system are established. The stiffness model of gear tooth crack is established by potential energy method. The changes of the motion state of the system with the increase of excitation frequency are obtained by calculating the displacement bifurcation diagram of cracked gear tooth. The influences of crack fault on each motion state are studied by using time domain, frequency domain, phase diagram and Poincaré cross section, and the fault frequency characteristics are summarized. By comparing the theoretical and experimental data of the vibration response characteristics of the system, the motion state of the system can be effectively determined and the crack fault can be identified.
Highlights
- The stiffness model of gear tooth crack is established by potential energy method.
- The changes of the motion state of the system with the increase of excitation frequency are obtained by calculating the displacement bifurcation diagram of cracked gear tooth.
- The influences of crack fault on each motion state are studied by using time domain, frequency domain, phase diagram and Poincaré cross section, and the fault frequency characteristics are summarized.
1. Introduction
Fatigue crack has always been one of the main forms of gear failure. It is difficult to identify in the early stage, but when the crack is discovered in the middle and later stage, it may have a great impact. Therefore, how to identify the crack fault earlier and more effectively is the focus of scholars' research. Previous scholars have focused on studying the bending fatigue strength of a single gear tooth and testing the bending fatigue life from the perspective of material fracture mechanics [1]. Although these results have proved effective. However, the research results have not been popularized in the multi-stage gear system and lack of effective diagnostic standards. Due to the complexity of the working conditions of the multi-stage gear system, the double increase of manpower and material resources consumed in the experiment, and the coupling characteristics of the system, the vibration response of the crack fault of the multi-stage gear system is not clear. Therefore, it is particularly important to find out the vibration response of the multi-stage gear system crack failure, and to combine the existing theories with practical applications to propose effective diagnostic indicators.
For the research of crack failure, a large number of scholars focus on crack model [2], strength analysis [3] and life prediction [4]. Using finite element software simulation method to test the bending fatigue life of gears has become an important means to study the bending fatigue of gears at home and abroad [5]. Although scholars have continuously improved finite element software, it is still difficult to obtain accurate data for the complexity of gears only by software simulation. In order to obtain high-precision bending fatigue life data of gears, it is necessary to combine actual tests to assist in completing the bending fatigue life test of gears. The test method of comprehensive experiment and simulation has been accepted by engineers in various countries. However, finite element software is only suitable for the strength analysis of a single gear. The dynamic solution of the system is required for the mutual coupling between multi-stage gears.
Because research on dynamic coupling mechanism and fault mechanism of multi-stage gear transmission system is not perfect, in order to solve the problem of fault identification, many scholars choose to analyze the experimental signals. With the rapid development of big data, neural network, machine learning and other disciplines in the past decade, many new analysis algorithms for complex signals are proposed, such as ant colony optimization algorithm [6], structured sparsity time-frequency analysis [7], particle swarm optimization (PSO) neural network [8], support vector machine [9], multiclass relevance vector machine (mRVM) [10], convolutional neural networks (CNN) [11], rotational system non-coaxiality [12], etc.
It is also a mainstream research direction to synthesize various algorithms to improve recognition efficiency. For example, Zhixiong Li [13-15] uses wavelet packet, empirical mode decomposition, Wigner distribution, AR model, blind source separation and other hybrid intelligent signal analysis methods to identify a variety of coupling faults. In addition, vibration signals collected by multi-channel sensors are used to monitor the bounded component analysis and detect the gear cracks of complex gearbox [16]. Yonglong Li [17] combines wavelet packet transform with support vector machine to detect gear fault. Xinbin Li [18] proposed a method combining EMD and support vector machine to identify different bearing faults. Dikang Peng [19] use transmission error and meshing phasing to distinguish local fault types and identify faulty gears. In recent years, people have carried out in-depth research on composite fault detection using intelligent methods. The intelligent classifier [20] can well identify different composite fault modes. But the existing intelligent algorithm lack of physical significance. In other words, it is difficult to understand how neural networks work [15].
One way to solve the above problems is to separate the fault by decoupling and separating the sub-signals corresponding to the fault. In the past few decades, great progress has been made in the decoupling diagnosis of complex gearbox signals, including wavelet decoupling, EMD decoupling, sequential tracking decoupling, sparse decomposition decoupling and independent component analysis decoupling [21]. However, there are few researches on the correlation of fault vibration sources. In any case, components work together to complete the function of a mechanism. Inevitably, the close connection and coupling effect between components will affect their dynamic response and performance. The vibration signals excited by different components and / or faulty components are related to a certain extent. This dependency/correlation may have a significant impact on the results of fault diagnosis, leading to misdiagnosis or missed diagnosis [22]. Unfortunately, although there is often a correlation in the actual complex vibration signal, the problem has not been well studied in the fault decoupling diagnosis. The correlation of fault vibration sources will greatly increase the difficulty of fault detection. Therefore, it is very important to find out the vibration source and the correlation of faults, and excavate the vibration response.
In order to analyze the fault vibration response of a multi-stage system from the source, it is necessary to study from the perspective of nonlinear dynamics. By establishing a nonlinear dynamic model, the changes of motion state, vibration characteristics and fault state of the multistage system are studied step by step from the forward direction. For the nonlinear dynamics modeling of gear system, there are many researches on the nonlinear dynamics of single-stage gear. For example, Wang [23] studied the bending-torsion coupling response of spur gear system under complex excitation, and Lin [24] calculated the transmission error using the bending-torsion axial coupling dynamics model of transmission system. Research on multi-stage gear system is not perfect due to its complexity and variety. The nonlinear dynamic models that can be used as references include two-parallel shaft gear transmission system [25], two-stage closed-form planetary gear set [26], two-stage helical planetary gear transmission system [27], multi-stage planetary gear system [28], multiple degrees of freedom nonlinear system [29], etc. This paper will study a multi-stage gear transmission system composed of a two-stage fixed-axis gearbox and a one-stage planetary gearbox. The nonlinear dynamic model in the author's previous research work [30] is used for simulation calculation.
In the author’s previous research, it was found that the motion state of the multi-stage gear transmission system is variable [31]. With the change of motion state, its vibration characteristics were also changed. The characteristics include the correlation between the gears at all stages. The characteristics of faults are different under different conditions. The change factor was not taken into account in previous studies. There may be a great deviation in identifying and judging system faults according to a unified standard. In this paper, fault characteristics under different motion states are discussed respectively. The vibration response of the system is excavated. The motion state and fault characteristics of the system are identified by comparing with the experimental data. This study has strong theoretical value and engineering application value.
2. System dynamics model
The gear transmission system shown in Fig. 1 was studied. There are two stage fixed shaft gears on the left and a planetary gear on the right. The lateral vibration displacements of the gears are not considered, only the torsional vibration is considered. Where spur gear 1, 2 compose the 1st stage fixed-axis gear for the input, spur gear 3, 4 compose the 2nd stage fixed-axis gear, the planet carrier is for the output. In Fig. 1. , , , , , , represent the angular displacement of sun gear, planet carrier, planetary gear (1, 2, 3, 4), spur gear 1, 2, 3, 4, respectively. Throughout this paper, the subscripts , , , , 1, 2, 3, 4 denote sun gear, planet carrier, planetary, ring gear and spur gear 1, 2, 3, 4. Quantities ,,,,,, are the base circle radius of gears. Quantities , , , denote the meshing stiffness of sun gear with planetary gear , ring gear with planetary gear , 1st stage fixed gear and 2nd stage fixed gear. Quantities , , , denote the damping of sun gear with planetary gear , ring gear with planetary gear , 1st stage fixed gear and 2nd stage fixed gear. is the input and is the output.
Fig. 1Gear transmission model [30]
![Gear transmission model [30]](https://static-01.extrica.com/articles/21828/21828-img1.jpg)
2.1. Dimensionless motion differential equation
The motion differential equation of the system was established, and the dimensionless treatment was carried out to obtain Eq. (1). The specific derivation process had been described in detail in the author’s paper [30]:
where, is the relative displacement of each stage meshing line, (1, 2, , ), , ; , , , are the equivalent mass of gear, is the equivalent moment of inertia of gear, , : , , , , , , are the moment of inertia of each gear on the shaft:
is the clearance nonlinear function, (1, 2, , ), written as:
where, is half of the clearance, (1, 2, , ).
The damping coefficient form:
where, , , , are damping ratio and , , , , , , are the mass of each gear.
The comprehensive meshing error of gear pair using the 1st harmonic form of meshing function, that is:
where, is the comprehensive meshing error amplitude of each gear, (1, 2, , ). is the comprehensive meshing error initial phase of each gear, (1, 2, , ); is the meshing frequency of each gear, (1, 2, , ).
Define time nominal scale , order , where ; is dimensionless displacement, , 1, 2, , ; is dimensionless excitation frequency, , 1, 2, , ; is dimensionless comprehensive meshing error amplitude, , 1, 2, , . is the dimensionless excitation frequency of the 1st-stage fixed-axis gear. When 1, it is the critical speed.
Fig. 2Meshing stiffness of gear tooth with crack propagation
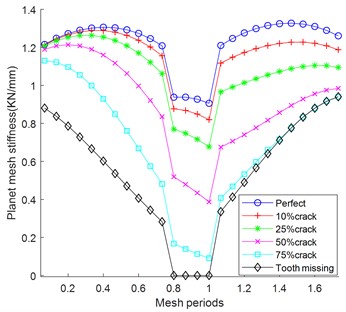
2.2. Failure models
The stiffness of cracked teeth is calculated by potential energy method [2]. The simulated crack occurs at the tooth root of gear 1 and extends inward at an angle of 70 ° to the center line. After reaching the center line, it changes the propagation direction and propagates to the other tooth root until fracture. The gear parameters of the system are shown in Table 1. The meshing stiffness of cracked gears with crack propagation is calculated as shown in Fig. 2.
Table 1Gear parameters
Gear | Number of teeth | Mass / g | / (g·m2) | Face width / mm |
1 | 29 | 125 | 0.05 | 30 |
2 | 100 | 1224.5 | 6 | 30 |
3 | 36 | 224 | 0.14 | 30 |
4 | 90 | 1111 | 4 | 20 |
28 | 41 | 0.007 | 20 | |
36 | 34.6 | 0.01 | 20 | |
848.7 | 0.76 | 20 | ||
100 | 20 |
3. Variation of nonlinear dynamic characteristics of crack fault
3.1. Gear displacement bifurcation diagram
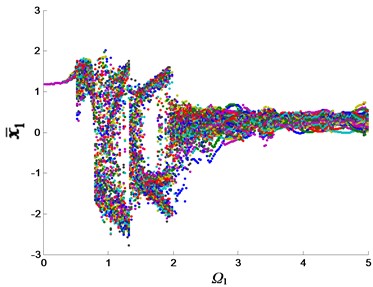
In order to compare the motion characteristics of the system under normal and fault conditions, the bifurcation diagrams of the system varying with the excitation frequency under the condition of no crack and 75 % crack were calculated. The structural parameters of the system are: 6.5 N·m, 8.5 N·m, gear clearance 3 μm, comprehensive meshing error amplitude 5 μm, meshing pair damping ratio 0.07, gear contact ratio is 1.68. As the crack fault was added to gear 1, the bifurcation diagram of gear 1 was calculated. The variable step Runge-Kutta method was used to solve the Eq. (1), and the bifurcation diagrams of the relative displacement of the fixed shaft gear 1 varying with the dimensionless excitation frequency were obtained, as shown in Fig. 3.
The bifurcation diagram is a two-dimensional graph showing that the dynamic system varies with a certain parameter, that is, to calculate the value of the fixed point corresponding to each parameter (discrete system) or the maximum value of oscillation (continuous system). Fig. 3 shows the oscillatory change of the relative displacement of gear 1 with the increase of the dimensionless excitation frequency . In Fig. 3(a), when is small, is a thin curve. It shows that the value of is almost the same during the movement. The vibration has only one period, and the motion state is single periodic motion. When increase to 0.5, changes from a thin curve to a wide curve, and the system changes from single periodic motion to quasi-periodic motion. At this time, the trajectory of is densely distributed in the area defined by the amplitude. When increase to 0.8, the resonance of the system makes the quasi-periodic motion changes into chaotic motion. The trajectory of becomes random and irregular, and the oscillation range increases. Then the system bifurcates into two-periodic motion. After a short period of chaotic motion, it bifurcates into three-periodic motion, which divided into three branches in the range of [1.6, 2]. Finally, the system re-enters the quasi-periodic motion.
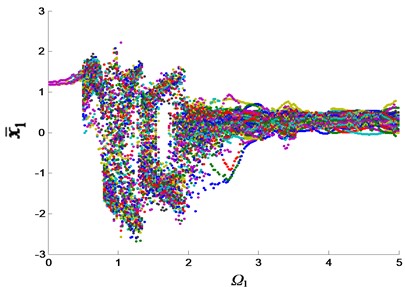
Comparing Figs. 3(a) and 3(b), I found that when the system has a fixed-axis crack fault, it affects the periodic, quasi-periodic and three-periodic motion of 3. The fault periodic motion is added into the original periodic motion. That is, a new periodic motion amplitude caused by the fault shock appears outside the original amplitude. Although the overall motion state does not change, it is obvious that the shock is more obvious in the vibration characteristics, and the fault frequency in the spectrum also increases. The motion state of the system can be roughly seen from the bifurcation diagram. In order to study the dynamic characteristics of each motion state in more details, it need to make a detailed analysis of each state.
Fig. 3Displacement bifurcation diagram of gear 1: a) normal state, and b) fixed-axis gear 75 % crack fault state
a)
b)
3.2. Nonlinear characteristics of each motion state of the system
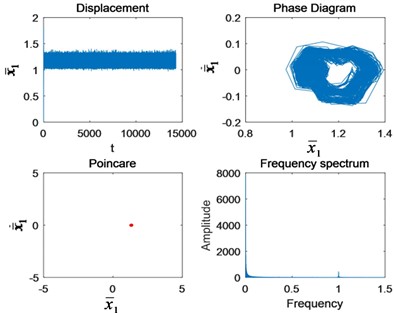
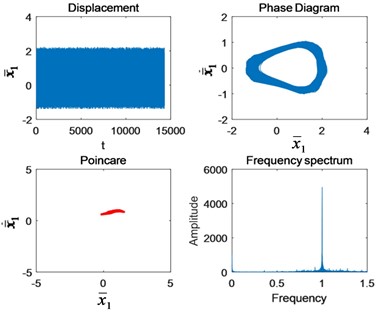
The nonlinear characteristics of different motion states are studied respectively. The time domain, frequency domain, phase diagram and Poincaré section of the system with the increase of are investigated. Phase diagram can express the state trajectory of the dynamic system on the phase plane. Poincaré section is a cross section of the trajectory of continuous motion, and the shape of the motion is succinctly judged according to the situation that the trajectory passes through the cross section. For each motion state, a sample is selected as the representative. The variable step size Runge-Kutta method is used to solve the nonlinear differential Eq. (1), and Fig. 4 is obtained. The characteristic frequencies of gears at all stages of the system are shown in Table 2.
Table 2Characteristic frequencies of gears at all stages
Characteristic frequency | Dimensional frequency |
Meshing frequency of the 1st-stage fixed-axis gear | 1 |
Meshing frequency of the 2nd-stage fixed-axis gear | 0.3599 |
Meshing frequency of the planetary gear | 0.0877 |
Frequency of the 1st-stage fixed-axis failure | 0.0345 |
Frequency of the planetary gear failure | 0.0024 |
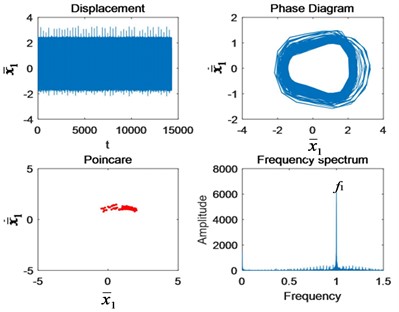
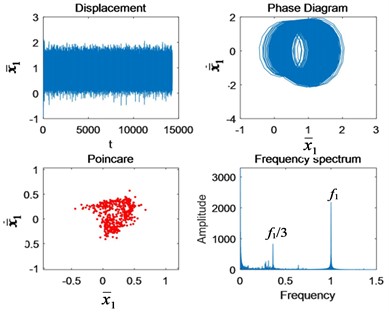
As can be seen from Fig. 4, when 0.4, the amplitude in both time domain and frequency domain are very small. The phase diagram is a tiny ring. The Poincaré section is a point. The system moves in single period motion. When 0.6, the amplitude in time domain and frequency domain increases. The amplitude of the circle of phase diagram increases. The Poincaré section becomes a point cluster. The frequency characteristic is the 1st-stage fixed-axis meshing frequency . At this time, the system enters a quasi-periodic motion state.
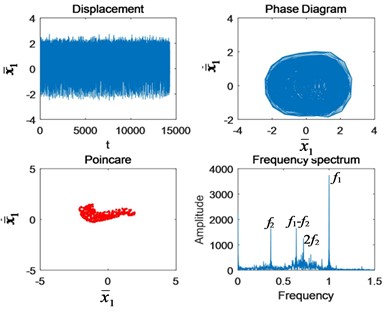
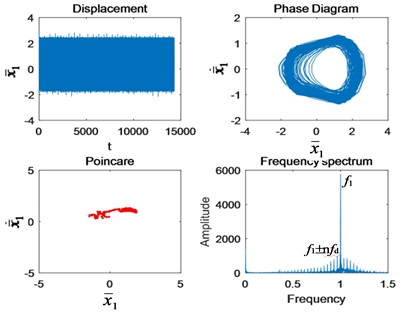
When 0.9, the system is in chaotic motion. The circle in the phase diagram has been filled, and the amplitude increases. The point cluster of Poincaré section increases. There are many frequency components in the spectrum. In addition to , there are also , its double frequency and modulation frequency .
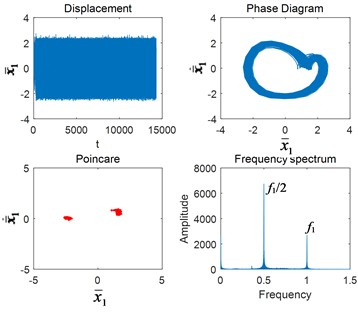
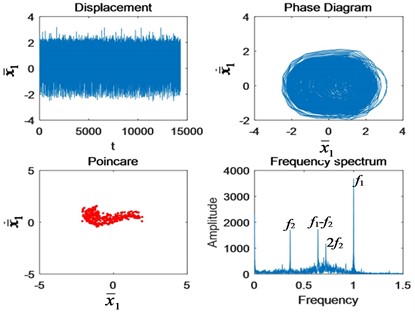
Due to the appearance of other frequency components, the vibration energy is no longer concentrated, which leads to the decrease of the amplitude of . Then the system gradually bifurcates into two-periodic motion ( 1.4). At this time, Poincaré section is two points, phase diagram returns to a two-period circle, and the frequency spectrum is dominated by the sub-harmonic resonance frequency /2.
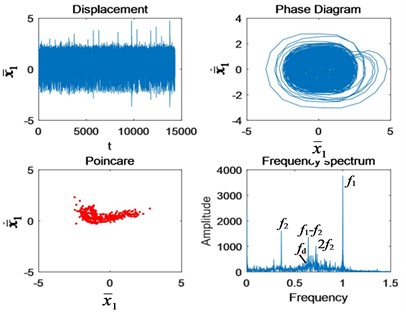
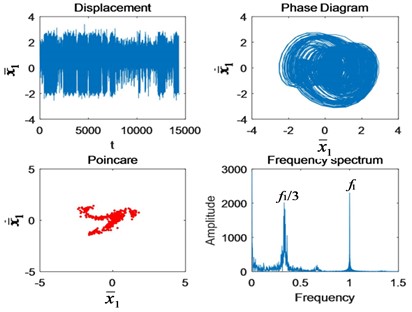
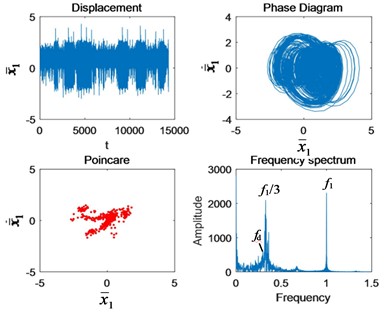
When 1.5, the circle in the phase diagram is filled again, the Poincaré section becomes a point cluster, and the system experiences a short period of chaotic motion. Then it bifurcates into triple periodic motion ( 2). Poincaré section bifurcates into 3 clusters. Phase diagram is a three-period circle. Sub-harmonic resonance frequency /3 is included in the spectrum. The triple periodic motion lasts a little longer, and the sub-harmonic resonance frequency /3 is found in the following experimental signals.
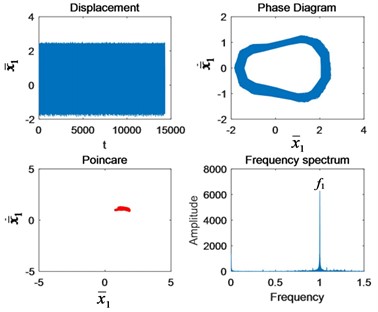
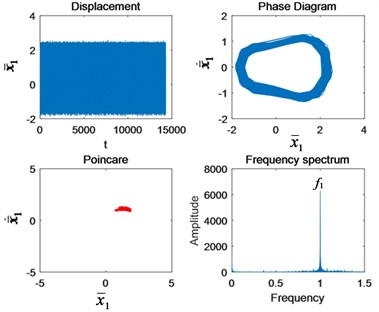
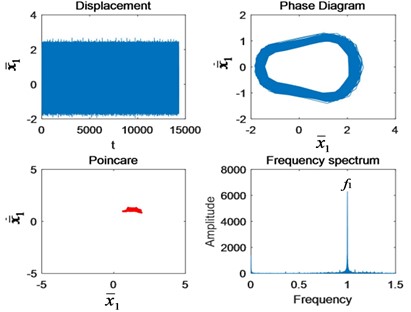
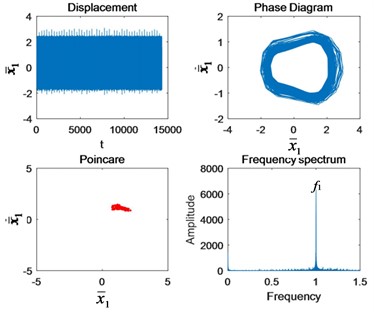
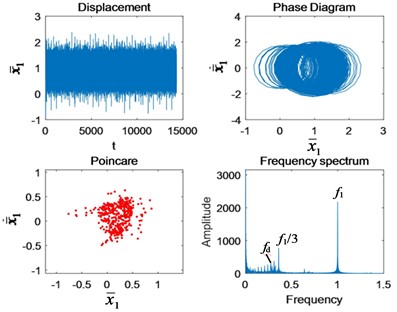
Fig. 4Nonlinear characteristics in each state of motion: a) Ω1= 0.4, b) Ω1= 0.6, c) Ω1= 0.9, d) Ω1= 1.4, e) Ω1= 1.5, f) Ω1= 2, g) Ω1= 2.5, and h) Ω1= 3
a)
b)
c)
d)
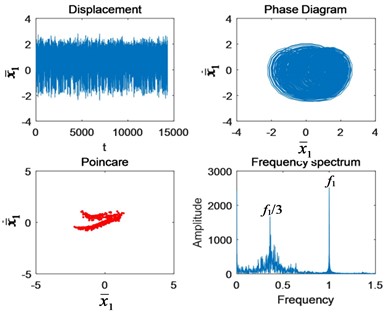
e)
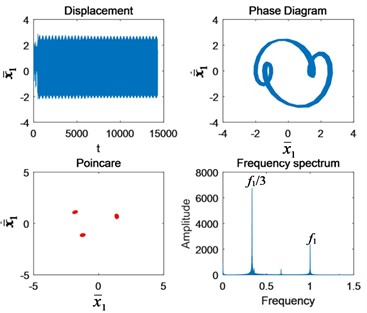
f)
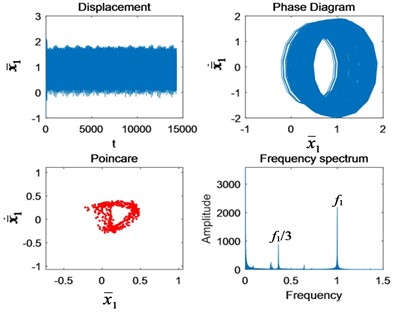
g)
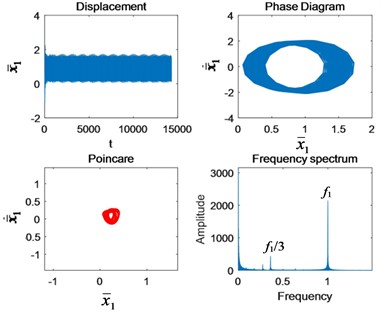
h)
When 2.5 and 3, the system returns to quasi-periodic motion. The Poincaré section is a limit cycle and gradually reduces to a point cluster. The phase diagram changes into a single periodic ring. The amplitude of is the highest in the spectrum. In addition, there is in the spectrum.
It can be seen that the vibration frequency characteristics of the system will change according to different excitation frequencies and motion states. If we do not explore the vibration characteristics of the system in each motion state, but simply take the vibration characteristics of a certain time as the benchmark sample for reference and comparison, the conclusion will appear a lot of deviation. The change of vibration frequency peak may not be caused by a fault but by the change of motion state. In order to study the effect of cracks on the vibration characteristics of the system, the analysis should be carried out separately for different motion states.
4. The influence of crack fault on each motion state
It can be seen from Section 3.2 that the motion states of the system in this paper are mainly divided into several categories: single periodic motion ( 0.4, 0.6), chaotic motion ( 0.9, 1.5), bifurcation ( 1.4, 2) and quasi periodic motion ( 2.5, 3). The author finds that with the increase of crack length, the change of fault characteristics under the same motion state is consistent. Therefore, only one sample is listed for each motion state to explain the changing trend of fault characteristics.
4.1. Single periodic motion
In the state of single period operation, when 0.6, the change of the nonlinear characteristics of the system is shown in Fig. 5 when the crack increases from 0 to 100 %.
As can be seen from Fig. 5, the initial crack propagation has little effect on the motion state of the system, and there is no obvious fault feature, which is difficult to detect. It is after the crack is more than half that the fault frequency of gear appears around the first meshing frequency and increases exponentially with the increase of crack. This is why the early crack failure is hard to detect. According to the principle of gear bending fatigue fracture mechanics, scholars divide the crack bending fatigue life into three stages: low speed expansion, stable expansion and unstable expansion [5]. Nonlinear vibration characteristics of the gear are basically consistent with the three phases. It shows that the model is reasonable and the research results are universal.
Fig. 5The change of nonlinear characteristics of the system caused by cracks when Ω1= 0.6: a) Perfect, b) 10 % crack, c) 25 % crack, d) 50 % crack, e) 75 % crack, and f) Tooth missing.
a)
b)
c)
d)
e)
f)
4.2. Changes of nonlinear characteristics of the system in different motion states
The nonlinear characteristics of the system with crack fault under chaotic motion ( 0.9), triple periodic motion ( 2) and quasi-periodic motion ( 2.5) are calculated respectively, as shown in Figs. 6-8. From Section 4.1, it is known that the nonlinear fault responses with cracks of 10 % and 25 % are not obvious, so they are no longer listed. Since the nonlinear characteristic diagram in normal state has been given in Fig. 4. Only the nonlinear characteristic diagrams with cracks of 50 % and 100 % in three kinds of motion states are listed.
Compared with Figs. 6 and 4(c), it can be seen that the impact of the system in the time domain is greater under chaotic motion. However, due to the irregular motion of chaotic motion itself, the phase diagram and Poincaré section have no obvious change before tooth missing. In frequency domain, the fault side-band mainly occurs at the 2nd-stage meshing double frequency .
Comparing Figs. 7 and 8 with Figs. 4(f) and 4(g), both triple periodic motion and quasi-periodic motion operate stably without impact under normal conditions. The phase diagram is a circle. After the occurrence of crack failure, the impact increases. The impact of triple periodic motion is more obvious. The phase diagrams are filled with fault cycles. The Poincaré section of the triple periodic motion gathers inward, while the quasi-periodic motion spreads outward. In the spectrum diagram, the fault period occurs around /3.
Thus, it can be seen that even if the same fault occurs in different motion states, the location of the fault side-band is also different.
Fig. 6The change of nonlinear characteristics of the system caused by cracks when Ω1= 0.9: a) 50 % crack, and b) tooth missing
a)
b)
Fig. 7The change of nonlinear characteristics of the system caused by cracks when Ω1= 2: a) 50 % crack, and b) tooth missing
a)
b)
Fig. 8The change of nonlinear characteristics of the system caused by cracks when Ω1= 2.5: a) 50 % crack, and b) tooth missing
a)
b)
5. Crack fault experimental analysis
Fig. 9 is a gear transmission system test rig. The axial direction of the input end of the fixed-axis gearbox was selected as the measuring point. The arrangement of the vibration accelerometer is shown in Fig. 9. The parameters are shown in Tables 1 and 2. The test rig was tested and analyzed in normal and crack states. The acceleration sensor was used for signal acquisition with a sampling frequency of 3000 Hz.
Fig. 9The multistage gear transmission system test rig: 1 – motor; 2 – torque sensor and encoder; 3 – two-stage fixed-axis gearbox; 4 – radial bearing load; 5 – one-stage planetary gearbox; 6 – brake
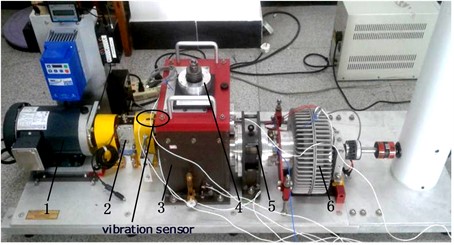
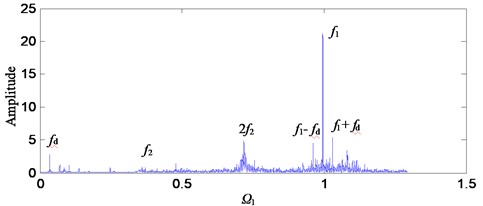
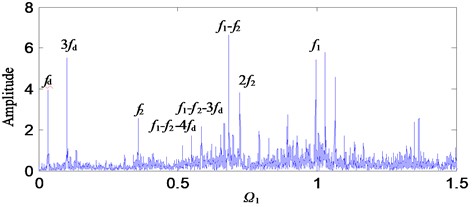
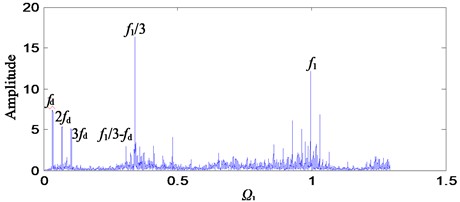
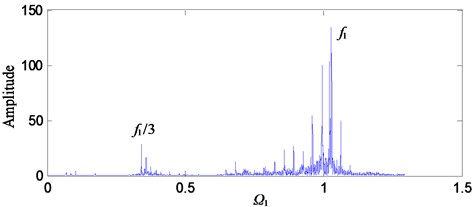
In order to investigate the variation of fault characteristics with excitation frequency, the speed-up process signal of the motor was tested and analyzed. The input frequency was set to 10 Hz, 20 Hz, 30 Hz and 40 Hz respectively (corresponding to the motor speed 600 r/min, 1200 r/min, 1800 r/min, 2400 r/min). The vibration signals of the axial measuring point of the fixed-axis gearbox were collected. In order to compare with the theoretical data, the spectrum was dimensionless. The vibration signal spectrum of the system under crack fault is shown in Fig. 10.
As can be seen from Fig. 10, the vibration responses of the system are different at different rotational speeds (excitation frequencies), which are consistent with the results of theoretical analysis. Comparing the frequency diagrams of Fig. 10 with Fig. 4, the motion state of the system at different rotational speeds can be roughly judged. For example, Fig. 10(a) is similar to Fig. 4(b), the system is in single periodic motion. Fig. 10(b) is similar to Fig. 4(c), the system is in chaotic motion. Fig. 10(c) is similar to Fig. 4(f), the system is in triple periodic motion. Fig. 10(d) is similar to Fig. 4(g), the system is in quasi-periodic motion.
In engineering applications, the 1st-stage fixed-axis failure frequency and its frequency multiplication are generally selected to monitor the 1st-stage fixed-axis gear failure. As can be seen in Fig. 10, appears around the main peak frequency in the form of side-band. This indicates that the system contains a 1st-stage fixed-axis gear fault. However, due to different excitation frequencies, the locations of fault features are different.
Fig. 10Dimensionless spectrum of crack fault at different speeds: a) motor speed 600 r/min, b) motor speed 1200 r/min, c) motor speed 1800 r/min, and d) motor speed 2400 r/min
a)
b)
c)
d)
In the state of single periodic motion, the fault characteristic frequency appears around , which is consistent with the conclusion of the study in Section 4.1. That is, the characteristic of Fig. 10(a) is consistent with that of Fig. 5. During chaotic motion, appears around -, and the characteristic of Fig. 10(b) is consistent with that of Fig. 6. During triple periodic motion, appears around /3, and the characteristic of Fig. 10(c) is consistent with that of Fig. 7. During quasi-periodic motion, appears around . Thus, it can be seen that the theoretical results are almost consistent with the experimental results. The influence of excitation frequency on the motion state and fault characteristic of the system is verified.
Because of the structural diversity of multi-stage gear transmission system, the change with excitation frequency is different under different system structures. The relationship between crack length and vibration characteristic needs to be verified by a large number of experiments. At present, no universal comprehensive fault identification method has been constructed. In order to apply the theoretical research results to practice, the author will try to combine theoretical research results with algorithms such as machine learning and neural network. The simulation data under different conditions will be used as “training” samples to try to improve the accuracy of fault identification.
6. Conclusions
In order to deeply explore the vibration characteristics and crack fault characteristics of multi-stage gear transmission system under different motion states, the vibration mechanism of crack fault is explored from a nonlinear point of view. According to the test-bed of multi-stage gear transmission system, the dynamic simulation model of the system and the crack stiffness model of gear teeth are established. Compare the nonlinear characteristics of the system under different excitation frequencies, the transition process of different motion states of the multi-stage gear transmission system was summarized. According to different motion states, the nonlinear dynamic changes of the system with crack propagation are studied respectively. The fault characteristics of the system under different motion states are summarized. After the dimensionless processing of the experimental signal, the motion state of the system and the location of the fault can be roughly judged from the non-linear point of view according to the theoretical research results. This study provides a theoretical basis for the vibration and fault response of multi-stage gear transmission system.
References
-
Daniewicz S. Conception and Development of Improved Analytical Prediction Models for Fatigue Induced Tooth Breakage Due to Cyclic Bending in Spur Gear Teeth. ProQuest Dissertations and Theses Global: ProQuest LLC, 1991.
-
Liang X. H., Ming J. Z., Mayank P. Analytically evaluating the influence of crack on the mesh stiffness of a planetary gear set. Mechanism and Machine Theory, Vol. 76, 2014, p. 20-38.
-
Silori P., Shaikh A., Kumar K. C. N., Tandon T. Finite Element Analysis of Traction Gear Using ANSYS. Materials Today: Proceedings, Vol. 2, Issues 4-5, 2015, p. 2236-2245.
-
Patil V., Chouhan V., Pandya Y. Geometrical complexity and crack trajectory based fatigue life prediction for a spur gear having tooth root crack. Engineering Failure Analysis, Vol. 105, 2019, p. 444-465.
-
Wang Z. Y., Xing Z. G., Wang H. D., Li G. L., Liu K. J., Xing Z. Research status of test method for bending fatigue life of heavy duty gear. Materials Review, Vol. 32, Issue 17, 2018, p. 3051-3059.
-
Deng W., Xu J. J., Zhao H. M. An improved ant colony optimization algorithm based on hybrid strategies for scheduling problem. IEEE Access, Vol. 7, 2019, p. 20281-20292.
-
Sun R. B., Yang Z. B., Chen X. F., Tian S. H., Xie Y. Gear fault diagnosis based on the structured sparsity time-frequency analysis. Mechanical Systems and Signal Processing, Vol. 1021, 2018, p. 346-363.
-
Pan H., Ma Q. Research on gear-box fault diagnosis method based on adjusting-learning-rate PSO neural network. Journal of Donghua University, Vol. 23, 2006, p. 29-32.
-
Wu F., Meng G. Compound rub malfunctions feature extraction based on fullspectrum cascade analysis and SVM. Mechanical Systems and Signal Processing, Vol. 20, 2006, p. 2007-2021.
-
Lei Y. G., Liu Z. Y., Wu X. H., Li N. P., Chen W., Lin J. Health condition identification of multi-stage planetary gearboxes using a mRVM-based method. Mechanical Systems and Signal Processing, Vol. 60, Issue 61, 2015, p. 289-300.
-
Kolar D., Lisjak D., Pająk M., Pavkovi´ D. Fault diagnosis of rotary machines using deep convolutional neural network with wide three axis vibration signal input. Sensors, Vol. 20, Issue 14, 2020, p. 4017-4019.
-
Pająk M., Muślewski Ł., Landowski B., Grządziela A. Fuzzy Identification of The Reliability State of The Mine Detecting Ship Propulsion System. Polish Maritime Research, Vol. 26, Issue 1, 2019, p. 55-64.
-
Li Z. X., Yan X. P., Yuan C. Q., Zhao J. B., Peng Z. X. A fault diagnosis approach for gears using multidimensional features and intelligent classifier. Noise and Vibration Worldwide, Vol. 41, Issue 10, 2010, p. 76-88.
-
Li Z. X., Yan X. P., Yuan C. Q., Peng Z. X., Li L. Virtual prototype and experimental research on gear multi-fault diagnosis using wavelet-autoregressive model and principal component analysis method. Mechanical Systems and Signal Processing, Vol. 25, Issue 7, 2011, p. 2589-2607.
-
Li Z. X., Peng Z. X. A new nonlinear blind source separation method with chaos indicators for decoupling diagnosis of hybrid failures: A marine propulsion gearbox case with a large speed variation. Chaos, Solitons and Fractals, Vol. 89, 2016, p. 27-39.
-
Li Z. X., Yan X. P., Wang X. P., Peng Z. X. Detection of gear cracks in a complex gearbox of wind turbines using supervised bounded component analysis of vibration signals collected from multi-channel sensors. Journal of Sound and Vibration, Vol. 371, Issue 9, 2016, p. 406-433.
-
Li Y., Shao R., Cao J. A new and effective method of gear fault diagnosis using wavelet packet transform combined with support vector machine. Journal of Northwestern Polytechnical University, Vol. 28, 2010, p. 530-535.
-
Li X., Chen Y., Zhang S. Hybrid fault diagnosis algorithm based on fusion decision of multiple LS-SVM classifiers. Journal of Sound and Vibration, Vol. 32, 2013, p. 159-164.
-
Peng D. K., Smith W. A., Borghesani P., Randall R. B., Peng Z. X. Comprehensive planet gear diagnostics: Use of transmission error and mesh phasing to distinguish localised fault types and identify faulty gears. Mechanical Systems and Signal Processing, Vol. 12715, 2019, p. 531-550.
-
Lei Y., He Z., Zi Y. Application of a novel hybrid intelligent method to compound fault diagnosis of locomotive roller bearings. Journal of Vibration and Acoustics, Vol. 130, 2008, p. 034501.
-
Li Z. X., Jiang Y., Hu C., Peng Z. Recent progress on decoupling diagnosis of hybrid failures in gear transmission systems using vibration sensor signal: A review. Measurement, Vol. 90, 2016, p. 4-19.
-
Li Z. X., Ge S. R., Zhu H. Key issues in the wear fault monitoring and diagnosis for critical components of coal cutters under deep coal seam. Tribology, Vol. 34, 2014, p. 729-730.
-
Wang J. G., Zhang J., Yao Z. Y., Yang X. F., Sun R., Zhao Y. X. Nonlinear characteristics of a multi-degree-of-freedom spur gear system with bending-torsional coupling vibration. Mechanical Systems and Signal Processing, Vol. 12115, 2019, p. 810-827.
-
Lin T. J., He Z. Y. Analytical method for coupled transmission error of helical gear system with machining errors, assembly errors and tooth modifications. Mechanical Systems and Signal Processing, Vol. 91, 2017, p. 167-182.
-
Li W., Sun J. D., Yu J. P. Analysis of dynamic characteristics of a multi-stage gear transmission system. Journal of Vibration and Control, Vol. 25, Issue 10, 2019, p. 1653-1662.
-
Zhang L. N., Wang Y., Wu K., Sheng R.Y., Huang Q. L. Dynamic modeling and vibration characteristics of a two-stage closed-form planetary gear train. Mechanism and Machine Theory, Vol. 97, 2016, p. 12-28.
-
Sun W., Li X., Wei J., Zhang A. Q., Ding X., Hu X. L. A study on load-sharing structure of multi-stage planetary transmission system. Journal of Mechanical Science and Technology, Vol. 29, Issue 4, 2015, p. 1501-1511.
-
Sun W., Ding X., Wei J., Hu X. L., Wang Q.G. An analyzing method of coupled modes in multi-stage planetary gear system. International Journal of Precision Engineering and Manufacturing, Vol. 15, Issue 11, 2014, p. 2357-2366.
-
Sheng L. C., Li W., Wang Y. Q., Fan M. B., Yang X. F. Nonlinear dynamic analysis and chaos control of multi-freedom semi-direct gear drive system in coal cutters. Mechanical Systems and Signal Processing, Vol. 1161, 2019, p. 62-77.
-
Wang X. Stability research of the planetary multi-stage gear transmission system with coupling faults. Journal of Sound and Vibration, Vol. 434, 2018, p. 63-77.
-
Wang X. A study on coupling faults’ characteristics of fixed-axis gear crack and planetary gear wear. Shock and Vibration, Vol. 2018, 2018, p. 4692796.
About this article

This research is supported by Natural Science Research Project of Shaanxi Provincial Department of Education (Program No. 19JK0912) and Natural Science Basic Research Program of Shaanxi (Program No. 2019JQ-898), China.
