Abstract
The Impact Echo (IE) method is a widely used method for the detection of concrete structures. The signal has non-stationary characteristics. Empirical mode decomposition (EMD) is one of the typical ways of dealing with non-stationary signals. Due to EMD having mode overlap and a breakpoint effect, Variational Mode Decomposition (VMD) has been proposed to overcome these problems. In this study, VMD is introduced into the analysis of the concrete component detection signals, and the impact echo analysis method based on VMD and marginal spectrum is established. The proposed method to solve the marginal spectrum is used in order to analyze the numerical simulation model’s IE signal. This method is able to correctly obtain the main frequency. When compared with the traditional Fourier spectrum, the marginal spectrum that is based on the VMD method shows that the band width that is present in the main frequency is narrow. Even in the presence of a highly noisy background, the method is able to correctly obtain the main frequency. At last, through the detection signal analysis of the non-defective concrete specimen and the concrete specimen with the circular hole, the results show that the proposed method can distinguish the signal in the different defective states of the concrete structures, which has obvious advantages compared with the Fourier spectrum.
1. Introduction
The Impact-Echo method (IE) is one kind of non-destructive testing technology of concrete developed during the mid-1980s [1-3]. As one of the new non-destructive testing methods, the impact echo method is less affected by ferromagnetic media than the ground penetrating radar method and its detection depth is large [4, 5]. IE is also easy to handle and simple. The ultrasonic method is only suitable for dual-faceted detection [6, 7]. But IE can be used in single-faceted detection. This method has obvious advantages compared with other traditional methods [8].
At present, the IE method on the thickness of concrete components and defects has been used in certain research studies [9, 10]. Generally speaking, the Fourier transform is used to solve the vibration signal spectrum to then obtain the concrete component thickness according to the frequency and apparent velocity. In the actual project, the shock echo is not only from the bottom of the reflection and reflection from the defect. This phenomenon makes the Fourier transform spectrum appear at multiple peaks. Thus, the traditional Fourier transform can correctly identify the main frequency. Additionally, the impact echo signal is non-stationary. So, the instantaneous parameters become significance for IE signal processing. While the traditional way includes short-time Fourier (STFT), Wigner-Ville distribution (WVD) and Wavelet transform (WT) etc. [11, 14]. Hilbert-Huang transforms is one of the typical methods for dealing with non-stationary signals. Empirical Mode Decomposition (EMD) transforms the non-stationary signal into a finite number of Intrinsic Mode Functions (IMF) [15, 16]. Then, the Hilbert transform is carried out on the intrinsic mode function and the Hilbert amplitude spectrum of the signal is constructed. Finally, the marginal spectrum is obtained by integrating the Hilbert spectrum. Compared with the Fourier spectrum, the marginal spectrum can reflect the actual spectrum of the signal more accurately. Due to the EMD experiencing problems of mode aliasing and end effects, Variational Mode Decomposition (VMD) was recently proposed to solve the problem. VMD can solve the problems of EMD [17, 20]. The VMD algorithm has been applied to some fields such as in mechanical fault diagnosis, structural damage identification, and it has achieved significant results [21, 23]. However, relevant reports on utilizing VMD to analyze Impact Echo data are lacking. Therefore, investigating the application of VMD theory in the vibration signal processing of Impact Echo is academically significant.
We addressed VMD to analyze the concrete component detection signals in the present paper. Based on the VMD and Hilbert transforms, the marginal spectrum of the IE signal was proposed to identify the thickness and defects of the concrete structure. Through collecting IE signal with numerical simulation and IE signal on one non-defective concrete specimen and one concrete specimen with circular holes, the VMD marginal spectrum and Fourier Spectrum was analyzed to study the applicability of our proposed method in the research.
2. Theory and methodology
2.1. The principle of VMD
Actually, VMD is a variational problem. To minimize the sum of the estimated bandwidths of each mode, we assumed that each mode has a finite bandwidth with different central frequencies. The alternating direction multiplier method was adopted to constantly update the mode and its central frequency, with the mode gradually demodulated to its corresponding baseband. Then, the final mode and corresponding center frequency were extracted.
Assuming that a signal is decomposed into intrinsic mode function (IMF), the corresponding variational problem’s solution can be expressed as follows:
The Hilbert transform of each IMF component is used to obtain the analytic signal:
where is the Dirichlet function and is IMF.
The center frequency is estimated for the obtained analytic signal and the spectrum of each analytical signal transformed to the baseband with a frequency shift:
where is the central frequency.
The norm of the demodulated signal is calculated, and the bandwidth of each mode is estimated. The variational problem is expressed as follows:
For the mentioned variational problem, the quadratic penalty function and Lagrange multiplier can be used to transform the problem into an unconstrained problem form:
where is the penalty factor, is the Lagrange multiplier, is the norm, and is the inner-product operator.
Finally, the multiplier alternate direction algorithm is used to solve the unconstrained variational problem of Eq. (4), and then the IMF can be obtained. During VMD processing, the parameters of the penalty factor and mode numbers need setup. We take Penalty factor 2000 in default. The mode numbers are from traditional EMD method.
2.2. Hilbert transforms and marginal spectrum
Using the VMD method, the original signal can be decomposed number of IMF:
The Hilbert transform is performed on the IMF . The transform form is expressed as:
where is Cauchy principal value, is time.
The analytical signal can be constructed through the Eq. (6) and IMF . The formula is expressed as:
In the signal of Eq. (7), its amplitude and phase is:
The phase of the signal is derived. Then, the instantaneous frequency of the signal can be obtained:
where is instantaneous frequency.
represents on the combined time-frequency plane and the Hilbert time-spectrum of can be expressed as:
Based on the overall Hilbert spectrum analysis of , the Hilbert time spectrum can be expressed as:
Finally, the marginal spectrum can be further defined through the Hilbert spectrum based on the Eq. (12):
3. IE Numerical simulation and analysis
3.1. Numerical simulation setup
The IE is based on the transient wave of the structure of non-destructive testing. The thickness presented by the specimen can be calculated with the following formula:
where refers to the thickness of the concrete structural specimen, is the wave velocity of the P-wave, and is the main frequency of the amplitude spectrum.
The of -wave velocity is related to Young’s modulus , Poisson’s ratio and the structural density is as following:
In his study, one concrete slab was used as subject. The dimensions of the concrete slab were 1.50×1.50 m with a thickness of 0.20 m. In Young’s modulus, , mass density and the Poisson’s ratio of concrete are 37.8 GPa, 2500 kg/m3, 0.2. According to the Eq. (15), the -Wave velocity was 4099 m/s. The corresponding theory of the main frequency was 10247 Hz according to the Eq. (14) of IE thickness computation.
According to the parameters which served as model, the response acceleration of IE over the concrete slab’s surface can be simulated through the use of ABAQUS, the finite element analysis software simulation. During the testing, the central part of the concrete floor was hit by the impact of the ball. The impact point and the acceleration receiver are shown below in Fig. 1. The distance that exists between the place in which the ball impacted, and the acceleration detector is 0.06 m. The acceleration sampling frequency resulted in 1 MHz, and the sampling length in 2 ms. The impact force of the ball can be determined by the following function:
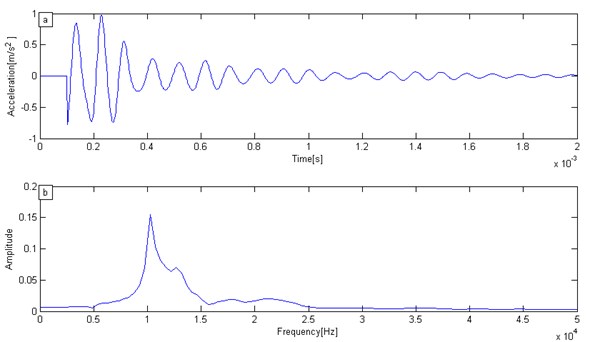
Based on the set parameters that were previously mentioned, the acceleration of the receiver’s change with time was simulated, as is shown in Fig. 2(a). The simulation signal was transformed to Fourier amplitude spectrum with Fourier transformation. The result of the transformation is shown in Fig. 2(b). The main frequency was 10254 Hz, according to the Fourier amplitude spectrum. The main frequency was compared with the theoretical frequency (10247 Hz), and it was found that the error margin was small.
Fig. 1Geometric model of concrete slab for IE simulation
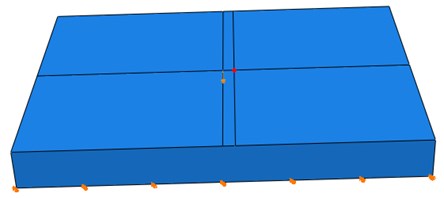
Fig. 2Simulation signal and its Fourier amplitude: a) IE simulation signal, b) Fourier amplitude spectrum
3.2. Marginal spectrum of simulation signal
According to the marginal spectrum, as mentioned by computational theory, the IMF of each mode can be obtained through the VMD method of the numerical simulation signal in Fig. 2(a). After that, the Hilbert spectrum of the signal was obtained by means of Hilbert transform. Finally, the Hilbert spectrum was integrated into the time domain, as well as with the marginal spectrum of the signal. The transformation result was shown in Fig. 3.
Fig. 3The marginal spectrum of simulation signal
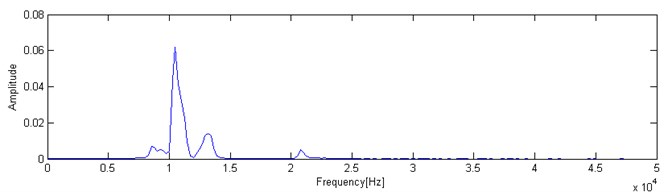
As is shown in Fig. 3, the main frequency in the marginal spectrum is of 10254 Hz (0.0349). This result is consistent with the Fourier transform results. From the comparison of both methods, it can be seen that the main frequency bandwidth is much wider when using the Fourier transform. However, the main frequency bandwidth is much narrower with the VMD method in the marginal spectrum. Therefore, the marginal spectrum that is based on the VMD method has a higher resolution than that of the traditional Fourier spectrum in the frequency response analysis of the IE signal.
3.3. The marginal spectrum of simulation signal under strong noise background
In general, the containing noise signal is the data minus the original noiseless data; and the ratio of the signal to noise energy is regarded as the signal to noise ratio (SNR). We can use this parameter to measure the degree of noise that is contained. The formula is as follows:
where is the signal to noise ratio, is the square norm, is the original noiseless data, and is the containing noise data.
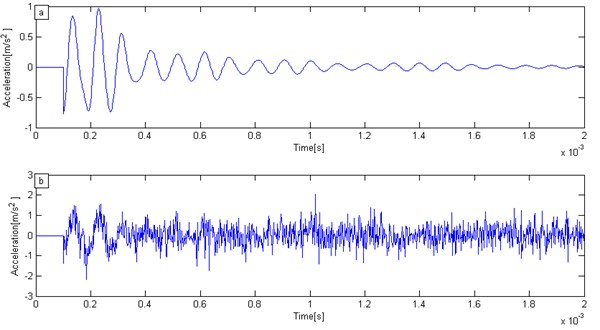
In the effect of the processing of the simulation signal containing the noise, we consider that the –8 by using the marginal spectrum. The white noise was added to the original numerical simulation signal in Fig. 4(a). The signal under a strong noise background is shown in Fig. 4(b).
Fig. 4Numerical simulation signal: a) original IE signal, b) IE signal under strong white noise
Base on simulation signal of IE under strong white noise, decomposed results of simulation signal of IE can be solved by VMD method. The decomposition results IMF1-IMF4 are presented in Fig. 5(a)-(d).
According to Fig. 5(a)-(d), the simulation signal of IE under strong white noise can be decomposed into four IMFs. We can find the number of IMF increases, and so does the frequency of IMF. It is worthy to mention the fact that no IMF contains random noise. This is because it is possible the VMD method decrease adaptively the effect of noise.
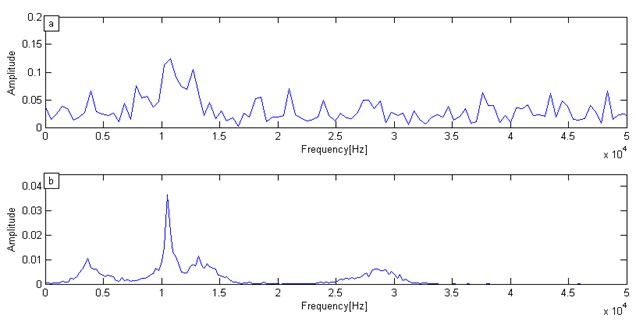
To evaluate further the capabilities of VMD, the Fourier spectrum and the marginal spectrum were solved by both the Fourier and the VMD transformations individually for the IE signal under a strong white noise background. The Fourier transform spectrum is shown in Fig. 6(a) while The VMD marginal spectrum is shown in Fig. 6(b).
According to Fig. 6(a), the many peaks of the vibrations are shown in the spectrum by using the Fourier transform with a background of strong white noise; it doesn’t display a single main frequency peak. The main frequency characteristic is not obvious. Because there are many frequency peaks in the Fourier transform spectrum. It is difficult to determine the main frequency based on Fourier transform spectrum.
However, the marginal spectrum was obtained in Fig. 6(b) through the use of the VMD method. The white noise background has little effect on the recognition of the main frequency peak; and even the main frequency can be found in the background of a strong white noise. We can easy to find the main frequency was 10254 Hz. Therefore, the marginal spectrum that was obtained by the VMD method can suppress the effect of interference. The proposed method has a significant advantage when it is compared with the traditional Fourier transformation.
Fig. 5Decomposition of simulation signal by VMD: a) IMF1, b) IMF2, c) IMF3, d) IMF4
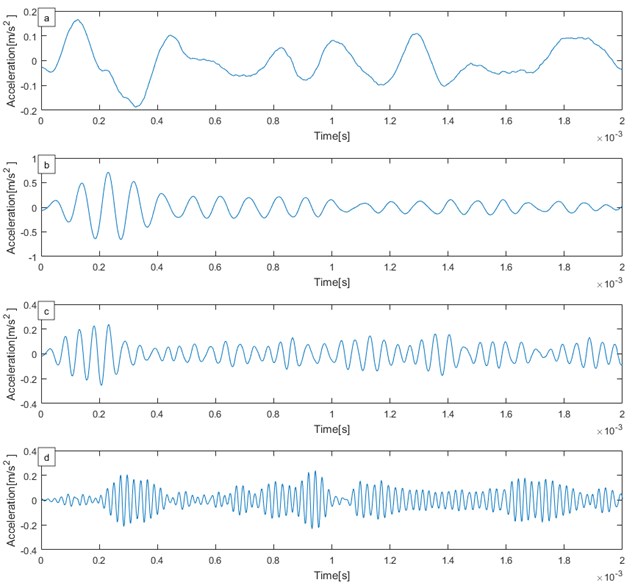
Fig. 6Numerical simulation signal spectrum: a) Fourier transform spectrum, b) VMD marginal spectrum
4. IE test and analysis
4.1. Introduction of the IE experiment
The concrete was constructed according to the requirements of the concrete test procedures. Based on the common mix ratio and molding process, one non-defective concrete model and one concrete model containing five circle holes were made. The two specimens’ geometric dimensions were 140c m×60 cm×150 cm. There are the specimen model containing one circle hole with a diameter that was 10 cm and a 20 cm distance from the upper surface. In order to ensure the accuracy and efficiency of the test, the grinding wheel or sandpaper was used on the test specimen surface to smooth the surface of the specimen. The test equipment used the Impact-Echo tester, as shown in Fig. 7(b). The Impact-Echo tester was used on the two types of model test specimens. The original signal was collected as shown in Fig. 8.
Fig. 7Concrete specimens and test equipment
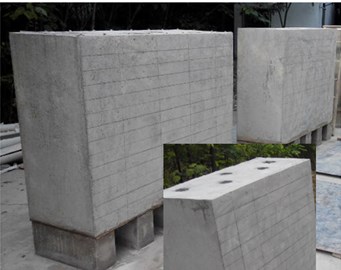
a) Concrete specimens
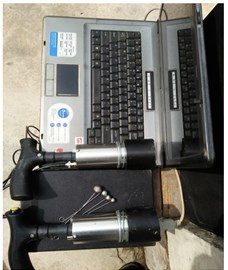
b) Test equipment
Fig. 8Specimens test signal: a) test signal for complete concrete specimen, b) test signal concrete specimen containing one hole
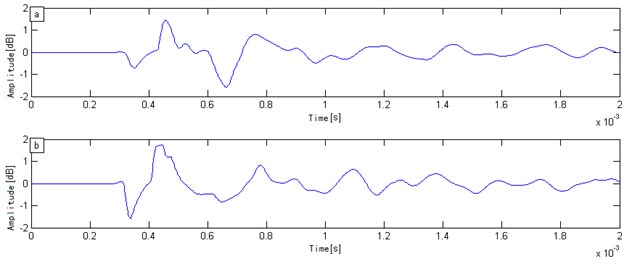
4.2. The analysis of the detection signal
We illustrate the abilities of VMD for the analysis of IE testing signal. The sampling signal of the experimental specimens was analyzed through the traditional Fourier transform and VMD. The frequency and marginal spectrums of the signal were obtained individually. Fig. 9 and Fig. 10 shows the Fourier frequency and VMD marginal spectra, respectively.
Based on the analysis results of Fig. 9 and Fig. 10, the main frequency was 3174 Hz from the Fourier transform, and the main frequency was 3171 Hz from the VMD method. Then, the velocity of the concrete specimens could be computed and were 3809 m/s and 3805 m/s respectively. The wave velocity was within the normal range of the concrete specimen. The difference between the two methods was small. These two methods were able to handle the non-defective concrete model specimen correctly. However, the spectral band obtained by the Fourier transform was wider than VMD. Compared with VMD, the resolution of the Fourier transform was relatively poor. Thus, the VMD method can obtain a narrower spectral band and higher resolution.
Similarly, the detection signal of the concrete specimen with circular holes was analyzed using the two methods. The Fourier transform spectrum and VMD marginal spectrum of the detection signal could be obtained in this case.
Fig. 9Fourier transform spectrum
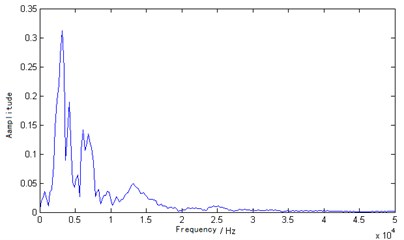
Fig. 10VMD marginal spectrum
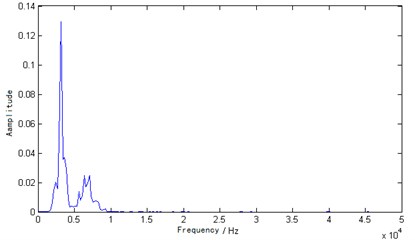
Fig. 11Fourier transform spectrum
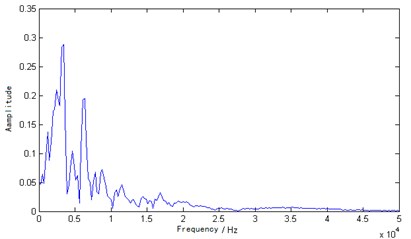
Fig. 12VMD marginal spectrum
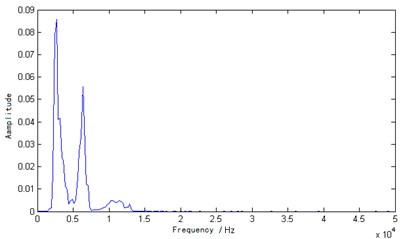
According to the analysis results of Fig. 11 and Fig. 12, the obtained main frequency was 3418 Hz through the Fourier transform and the main frequency was 2683 Hz through the VMD transform. Fig. 11 shows that there were multiple peaks in the Fourier transform spectrum and the main frequency (3418 Hz) was greater than 3174 Hz, which is inconsistent with the actual results and pseudo-peak appearance. The resolution was also poor based on the Fourier transform spectrum. Secondly, the reflection will appear on the interface of the hole and concrete, however, sub-level peak is also not obvious. Otherwise, the main peak obtained was 2683 Hz through the marginal spectrum, which was less than 3171 Hz. This phenomenon appeared in Fig. 12. Because the reflected wave needed to bypass the hole and reach the floor, the total distance was greater than twice the thickness of the specimen. So, the time lengthens, and the specimen’s thickness moved toward low frequency movement. The result was consistent with the actual situation. In the interface between the hole and concrete, there was one reflection. Fig. 12 also shows one significant sub-level peak. The results showed that the VMD marginal spectrum has high resolution compared to the Fourier transform spectrum. We can find both the analysis of the IE simulation signal and the analysis of the IE testing signal can be achieved good effect by VMD method. From the spectra of IE testing signal, it can be appreciated that the VMD marginal spectrum has potentiality for IE signal analysis.
5. Conclusions
Based on the VMD and Hilbert transforms theories, the VMD marginal spectrum analysis method was proposed for the IE signal analysis. In IE numerical model and the concrete model test experiments, the VMD analysis method was used to process test signal, and its analysis results were compared with the traditional Fourier transform spectrum analysis. The following conclusions can be drawn:
1) Through the IE signal analysis of the numerical simulation, the main frequency bandwidth can be obtained by means of Fourier transform, which is much wider in the Fourier transform spectrum, while the main frequency bandwidth that is obtained by the VMD method was narrower. The VMD marginal spectrum has a higher performance when compared with that of the traditional Fourier spectrum.
2) Through the analysis of the IE signal under the background of strong noise, the influence of the interference was able to be suppressed by means of the marginal spectrum. The proposed method has a significant advantage over the traditional Fourier transform.
3) Using VMD and Hilbert transform, the IE signal of the marginal spectrum can be achieved. The marginal spectrum can correctly reflect the integrity and defects of the concrete specimens.
4) The analysis results of the Fourier transform and VMD have little differences in the calculation of the concrete thickness. But the marginal spectrum based on the VMD method can obtain higher resolutions.
5) Through analysis of the defective concrete specimen, the marginal spectrum obviously avoids false peaks and has high resolutions based on the comparative marginal spectrum and frequency spectrum analysis.
References
-
Carino N. J. The impact-echo method: an overview. ASCE World Structural Engineering Conference, 2001.
-
Johnson M. R. Nondestructive evaluation of in-place concrete strength in plate structures by the impact-echo method. ACI Materials Journal, Vol. 93, Issue 3, 1996, p. 260-271.
-
Lin Y., Sansalone M. Detecting flaws in concrete beams and columns using the impact-echo method. ACI Materials Journal, Vol. 89, Issue 4, 1992, p. 396-405.
-
Yehia S. A. Comparison between ground penetrating radar (GPR) and impact echo (IE) for detection of common concrete bridge decks defects. American Society of Civil Engineers, Vol. 179, 2005, p. 1-7.
-
Song S., Kim H., Park D., et al. Assessment of impact-echo method for cavity detection in dorsal side of sewer pipe. Journal of the Korean Geotechnical Society, Vol. 32, Issue 8, 2016, p. 5-14.
-
Hong S., Lee Y., Kim S., et al. Estimation of thickness of concrete structures using the impact echo method and ultrasonic pulse velocity method. Architectural Research, Vol. 18, Issue 4, 2016, p. 179-184.
-
Xiao Y. F., Zhang D. H., Liu L. Internal imperfection detection of concrete composite component using ultrasonic method and impact-echo method. Advanced Materials Research, Vol. 639, Issue 640, 2013, p. 1046-1050.
-
Garbacz A., Piotrowski T., Courard L., et al. On the evaluation of interface quality in concrete repair system by means of impact-echo signal analysis. Construction and Building Materials, Vol. 134, 2017, p. 311-323.
-
Zou C., Chen Z., Ping D., et al. Experimental and numerical studies on nondestructive evaluation of grout quality in tendon ducts using impact-echo method. Journal of Bridge Engineering, Vol. 21, Issue 2, 2016, https://doi.org/10.1061/(ASCE)BE.1943-5592.0000759.
-
Li B., Cao J., Xiao J., et al. Robotic impact-echo non-destructive evaluation based on FFT and SVM. 11th World Congress on Intelligent Control and Automation, 2015.
-
Gan L., Zhou L., You X., et al. The instantaneous frequency extraction of GPR B-scan data based on HHT method. International Conference on Machine Learning and Cybernetics, Vol. 3, 2012, p. 982-985.
-
Wang J., Lian S., Shi Y. Q. Hybrid multiplicative multi-watermarking in DWT domain. Multidimensional Systems and Signal Processing. Vol. 28, Issue 2, 2017, p. 617-636.
-
Zhao H. M., Li D. Y., Deng W., et al. Research on vibration suppression method of alternating current motor based on fractional order control strategy. Proceedings of the Institution of Mechanical Engineers Part E Journal of Process Mechanical Engineering, Vol. 231, Issue 3, 2016, p. 786-799.
-
Xiong L., Xu Z., Shi Y. Q. An integer wavelet transform based scheme for reversible data hiding in encrypted images. Multidimensional Systems and Signal Processing, Vol. 29, Issue 3, 2018, p. 1191-1202.
-
Huang N. E., Wu Z. A review on Hilbert-Huang transform: method and its applications to geophysical studies. Reviews of Geophysics, Vol. 46, 2008, https://doi.org/10.1029/2007RG000228.
-
Zhao H., Sun M., Deng W., et al. A new feature extraction method based on EEMD and multi-scale fuzzy entropy for motor bearing. Entropy, Vol. 19, Issue 1, 2016, p. 14.
-
Jin Z., Na W., Huan K., et al. An improved method to calculate phase locking value based on Hilbert-Huang transform and its application. Neural Computing and Applications, Vol. 24, Issue 1, 2014, p. 125-132.
-
Dragomiretskiy K., Zosso D. Variational mode decomposition. IEEE Transactions on Signal Processing, Vol. 62, Issue 3, 2014, p. 531-544.
-
An X., Pan L., Zhang F. De-noising of hydropower unit throw based on EEMD and approximate entropy. Journal of Hydroelectric Engineering, Vol. 34, Issue 4, 2015, p. 163-169.
-
Yi C., Lv Y., Dang Z. A Fault diagnosis scheme for rolling bearing based on particle swarm optimization in variational mode decomposition. Shock and Vibration, Vol. 2016, 2016, p. 9372691.
-
An X., Yang J. Denoising of hydropower unit vibration signal based on variational mode decomposition and approximate entropy. Transactions of the Institute of Measurement and Control, Vol. 38, Issue 3, 2016, p. 282-292.
-
An X., Tang Y. Application of variational mode decomposition energy distribution to bearing fault diagnosis in a wind turbine. Transactions of the Institute of Measurement and Control, Vol. 5, Issue 2, 2016, p. 753-772.
-
Han T., Jiang D. Rolling bearing fault diagnostic method based on VMD-AR model and random forest classifier. Shock and Vibration, Vol. 2016, 2016, p. 1-11.
About this article

This research was funded by the Open Research Fund of Key Laboratory of Hydraulic and Waterway Engineering of the Ministry of Education (Grant No. SLK2017A02), the Open Research Fund of the Fundamental Science on Radioactive Geology and Exploration Technology Laboratory (Grant No. RGET1502) and A Project Funded by the Priority Academic Program Development of Jiangsu Higher Education Institutions (Grant No. 3014-SYS1401).
