Abstract
In this paper, using discrete model of traffic flow the dynamics of traffic flow against traffic lights controlled road section points was analyzed. In the article is determined what is going on with the traffic flows when period of traffic lights switching was chosen. For the results, road points at different distances from traffic light-controlled road points were chosen. The flow, velocity and density dynamics of traffic flows are determined at different points before the traffic lights. Fundamental diagrams to determine the dependence of traffic flow and density are developed.
1. Introduction
One of the main reasons for traffic jams formation is the intensive traffic flow rate and the intersection conduction. It is difficult to control the flow of the traffic flow while entering the main streets, but easier to manage the flow of passing through the traffic light controlled intersections. For this purpose, traffic flow models are developed to evaluate and select an optimal variant for the traffic light switching cycle.
In the scientific article [1] authors used two-dimensional Biham-Middleton-Levine traffic flow model to analyze the effects of traffic light period. Authors emphasizes the two systems phases: coexistence of free flow and jam. In the jam phase during the decrease of velocity the density and/or system size increase.
Based on the researchers [2] statements authors try to determine the capacity of traffic lights control mode adaptation to advanced characteristics of traffic flows. Therefore, the main subject of the study is to define the method of assessment of impact of main characteristics of the traffic flow on capacity of signal-controlled intersections. In this way, an intellectual transport system with an obligatory option of a subsystem of transport by applying of advanced characteristics of traffic flows is monitoring. As a result of the use of these systems main transport problems such as reduction of vehicle delays, decrease of the number of unintended stops at intersections, improvement of environmental performance, partial or complete elimination of congestions at the busiest sections of road networks, reduction of the number or road traffic accidents, could be solved.
It is also proposed [3] to introduce the density difference between the leading and following lattice and to modify the hydrodynamic model of traffic flow. Therefore, the main factor of the hydrodynamic model is the density difference and as many simulations show the increase of reaction coefficient, drivers’ behaviors become more realistic when jams are approaching.
Other researchers [4] states that the main attention should be paid to the Maxwell-Boltzmann distribution of ideal gases and the similarity between the fundamental diagrams of vehicular traffic. Based on this mind, in this article a methodology to model the fundamental diagram as a stochastic process is used.
The increase of the inflow density leads to origination of the traffic jam and its counter-flow propagation. Here is also proposed [5] to improve the road handling capacity by the use of the traffic lights, when the duration of the different parts of the traffic lights cycle is properly chosen.
The objective of the paper is to determine the dynamics of formation of vehicle rows before the regulation of traffic light points. The following tasks have been implemented: to create a road section dynamic model, to choose the input parameters and traffic light switching frequency, to set the traffic flow parameters, using the discrete model of traffic flow, before the traffic lights road points are regulated.
2. Methodology
For simulation road sections a calculation scheme (Fig. 1) for one traffic direction was created. The section of the road was divided into sections every 50 meters. The length of the road was chosen according to one of the larger streets of Vilnius and the points of the traffic lights were chosen according to the larger intersections in this section of the road. In the calculation scheme, the points without the traffic lights are indicated by a symbol  and points with traffic lights are indicated by a symbol
  . In the scheme between points with traffic lights, there are sections without traffic lights of the corresponding length according to the number of points.
Fig. 1One-way road section calculating scheme: – traffic line point without traffic light; – traffic line point with traffic light

By analyzing the dynamics of traffic flows before traffic lights controlled road points, a discrete model of traffic flows was used. This model consists of a system of equations, which is described in more detail in scientific articles [6, 7]. Using the discrete transport flow model, a system of equations for each road point, along with the description of adjacent points, is entered (Eq. (1)):
where: , – right side of the equation for vector elements; – traffic flow velocity in the th point, m/s; – traffic flow density in the th point, veh/m.
Starting the street’s traffic simulation, input parameters are entered to the measure of the flow of transport:
where: – amplitude of flow; – angular velocity, rad/s; – parameter.
The vehicle entered the street at the beginning of the initial speed:
where: – amplitude of velocity; – angular velocity, rad/s; – parameter.
In the simulated system, all traffic lights switch at the same time. Traffic lights switching period is selected based on [8] scientific article, which provides that the maximum traffic flow at traffic lights switching period 148 s. The traffic light signal switching cycle is shown in Fig. 2.
Fig. 2The traffic light switching cycles
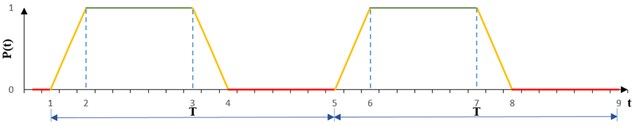
The complete traffic light switching cycle consists of five turning points. In the 1st step, a yellow signal is switched on, in the 2nd – green, in the 3rd – yellow, in the 4th – red, and the 5th step completes the traffic light switching cycle, which consist one period.
3. Results
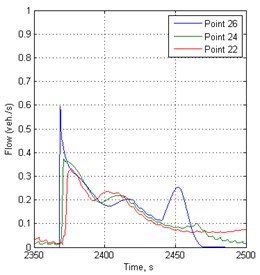
After modeling at traffic signal switching period 148 s, the results of traffic flow speed, density and flow results at 50, 150 and 250 meters before traffic lights are shown in Fig. 3-5. From them it can be seen how the dynamic processes of the traffic flow are changing as far away points are from the traffic light controlled points.
Fig. 3Velocity variation in time before traffic lights in 148 s period
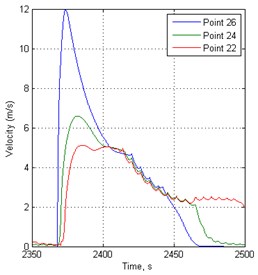
a)
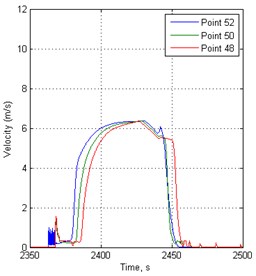
b)
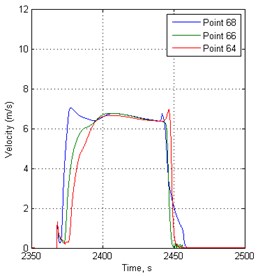
c)
Fig. 4Density variation in time before traffic lights in 148 s period
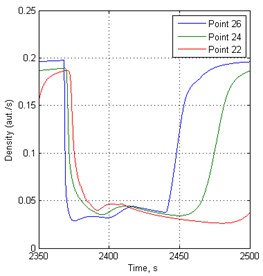
a)
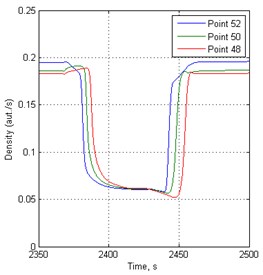
b)
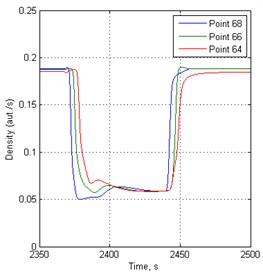
c)
Fig. 5Flow variation in time before traffic lights in 148 s period
a)
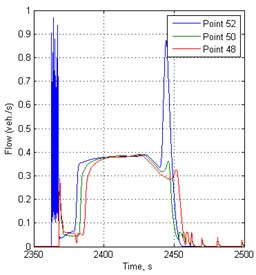
b)
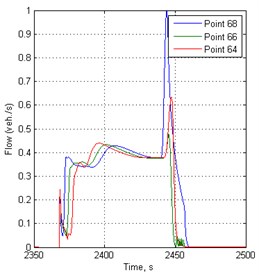
c)
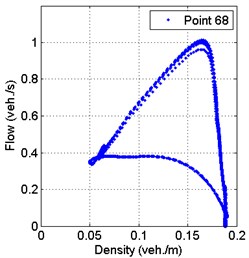
Fundamental flow-density diagrams in 148 s period are shown in the Fig. 6. These results are calculated 50 meters from the traffic light.
Fig. 6Fundamental flow-density diagram in 148 s period
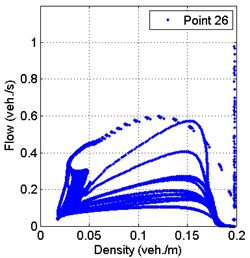
a)
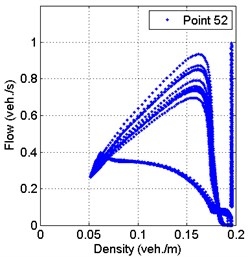
b)
c)
4. Conclusions
From the results, it is seen that vehicles cannot move immediately at more overloaded intersections. At the closest point from the intersection is the vibrations of speed and flow, showing that the intersection is already overflowing when the green traffic signal is switched on.
It is noted that the dynamics of vehicle traffic flow are very different before individual intersection with traffic lights regulation in the same road section at the same time.
Approaching the end of the simulated road vehicle queues forming time significantly shorter before the traffic lights controlled road points.
In the case of the traffic light switching period 148 s, the traffic intensity before the traffic light at 69 point is higher by approximately 2 times than before the traffic light at the 27th point. This means that at the end of the simulated road the number of cars will travel more per unit of time.
Looking at the flow-density fundamental diagrams, which show the relationship between these parameters, it is evident that the maximum flow parameter distribution at the beginning of the simulated road and at the end the distribution is the smallest.
References
-
Sun D., Jiang R., Wang R. Timing of traffic lights and phase separation in two-dimensional traffic flow. Computer Physics Communications, Vol. 181, 2010, p. 301-304.
-
Novikov A., Novikov I., Katunin A., Shevtsova A. Adaptation capacity of the traffic lights control system (TSCS) as to changing parameters of traffic flows within intellectual transport systems (ITS). Transportation Research Procedia, Vol. 20, 2017, p. 455-462.
-
Tian J., Yuan Z., Jia B., Li M., Jiang G. The stabilization effect of the density difference in the modified lattice hydrodynamic model of traffic flow. Physica A, Vol. 391, 2012, p. 4476-4482.
-
Ni D., Hsiehb h., Jianga T. Modeling phase diagrams as stochastic processes with application in vehicular traffic flow. Applied Mathematical Modelling, Vol. 53, 2018, p. 106-117.
-
Smirnov N., Kiselev A., Nikitin V., Silnikov M., Manenkova A. Hydrodynamic traffic flow models and its application to studying traffic control effectiveness. WSEAS Transactions on Fluid Mechanics, Vol. 9, 2014, p. 178-186.
-
Bogdevičius M., Junevičius R. Investigation of traffic flow dynamic processes using discrete model. Journal of KONES Powertrain and Transport, Vol. 21, Issue 4, 2014, p. 15-19.
-
Junevičius R., Bogdevičius M. Mathematical modelling of network traffic flow. Transport, Vol. 24, Issue 4, 2009, p. 333-338.
-
Danilevičius A., Bogdevičius M. Investigation of traffic light switching period affect for traffic flow dynamic processes using discrete model of traffic flow. Procedia Engineering, Vol. 187, 2017, p. 198-205.
About this article

