Abstract
This paper presents an important study of environmental Atmospheric analysis at industrial factories in Bangladesh. An Arduino based real time control system with gas and noise sensors has been developed to collect the data in various industries. The system then has been made operational at few cement factories to measure the noise (db) and dust (μg/m3) and compared with international standard requirements to understand whether the factories are providing healthier environment. Result shows both the noise and air quality to be within the borderline except few cases in which the solution has been proposed to improve the factors.
1. Introduction
Cement production, in Bangladesh, plays a role in the growth of the nation. Bangladesh, a key part of the economy, is gradually shaking off the impacts of the political chaos in recent years. The real estate sector now contributes around 7 percent to the GDP. Around 0.1 million skilled employees are working in this sector [1, 2]. Due to rapid change of infrastructure and demand increase of cement, it is expected for cement companies to increase their production capacity and extend their units. All of the new projects have to be met with international standards. A research team has been sent to the existing factories therefore to get the current status of Environment Management Plan. Environmental Management Plan/Procedure(EMP) basically consists of a set of mitigation, monitoring and institutional measures to be taken during the design, construction and operation (post-construction) stages of the project. The EMP has been designed keeping in view the regulatory and other requirements to ensure the following: minimum disturbance to the native flora and fauna and compliance with the air, water, soil and noise quality norms [3-8]. In this paper, we describe hardware synthesis for Air Quality and Sound detector to one of the cement production plants in Bangladesh where CO2, CO, NOx and SO2 in the flue gas were emanating. In the project, emphasis on collecting, processing, and sending data were provided. An Arduino microcontroller was used in the control system to display real time data. This system may use in various scientific projects in future, e.g. environmental monitoring applications, wireless sensor motes for data-intensive applications, and micro-incubator applications and poultry farming etc.
2. Noise and air quality standards
The main sources of noise pollution are industries, motorized vehicles, construction works and indiscriminate use of loudspeaker. At present noise level in Dhaka city is estimated ranging from 60 to 100 decibels. At a level of 80 decibels, sound is annoying. It has also been found that if the daytime emission level exceeds 65 dB, a strong positive correlation is found towards cardiovascular risk [11]. However, for industrial purpose, the standard industrial noise level is 85 dB according to Department of Environment (DoE), Bangladesh [11]. Another form of pollution caused by cement factories is dust. Dust always has been one of the main factors of human health issues. Particular Matter (PM) which is 10 microns or less is (PM10 <= 10) considered to be the most fatal factors to human health as it goes deep inside the lungs and causes serious cardiovascular and respiratory diseases. According to WHO, guideline value of PM 2.5 is around 10 μg/m3 annual mean and 25 μg/m3 24-hour mean [12]. However, Bangladesh Department of Environment with support from world bank implemented “Air Quality Management Project (AQMP)” during 2000-2007. For this Suspended Particular Matter, standard (SPM) is 200 μg/m3 [13]. In this project, we focus our work on SPM. If such guideline is not maintained and subjects are exposed to dust for considerable amount of time, it will lead to respiratory disorder and cardio-vascular, skin and many other health issues [10].
3. Methodology
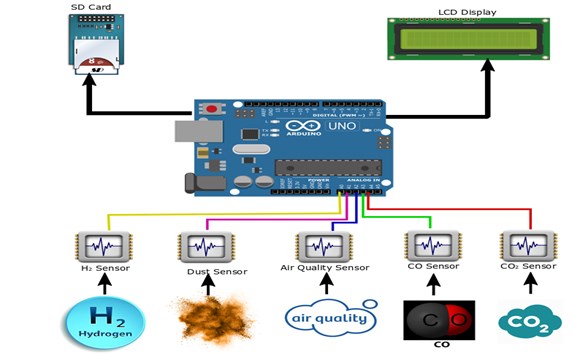
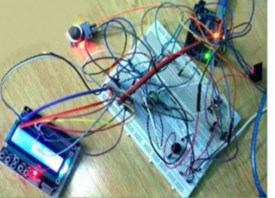
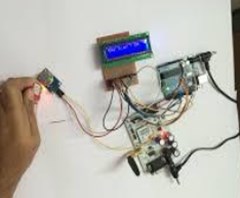
In this setup, Arduino Uno was used as the heart of the system where five sensors are connected namely CO2 sensor, CO sensor, Hydrogen sensor, noise sensor and air quality sensor. Connected as analog input, the Arduino code was written for each sensor to process the values into quantifiable data. After being processed, the output was written in SD card and was shown real time in LCD display. The entire system was real time and portable; therefore, could fit into a small briefcase. The system was then brought into difference cement factories and data was gathered in different places of the factory to find out the overall scenario.
Fig. 1Process flow diagram
4. Hardware and software architecture
In this section, details of the sensors, programs and hardware used to develop the data acquisition system have been provided.
Noise sensor: “Grove Sound Sensor” which is basically a microphone was used in the RTS. This microphone is based on LM358 amplifier. It can detect the strengths of the sound in the surrounding environment [9].
Dust sensor: sharp’s GP2Y1010AU0F is an optical air quality sensor, or may also be known as optical dust sensor, is designed to sense dust particles. This sensor is designed to sense fine particles through an infrared emitting diode which reflects the light from particles. Fig. 3 indicates the circuit diagram of the sensor. The output from the sensor gives analog voltage. According to the datasheet, to get the density in μg/m3 unit, the voltage is used in the following equation:
Process flow diagram: The microcontroller with an external oscillator of 16 MHz has really excellent capabilities of switching and transmitting command. The ratings of the power supply are 12 V and 2 A currents for operation. In Fig. 4, flowchart has been provided for the developed real time control system. Arduino is programmed according to the diagram and hence, it controls all the sensors and reads the data in the LCD display.
Fig. 2Noise sensor and internal circuit
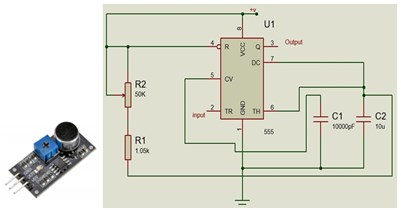
Fig. 3Circuit design of a dust sensor
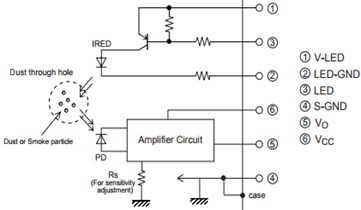
Fig. 4Flowchart of the real time control system
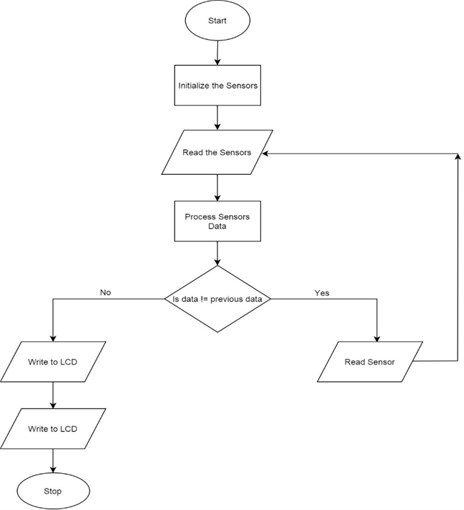
Fig. 5Developed arduino based real time data monitoring control system
a)
b)
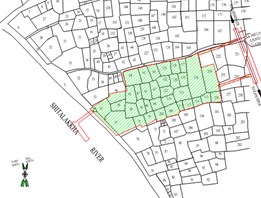
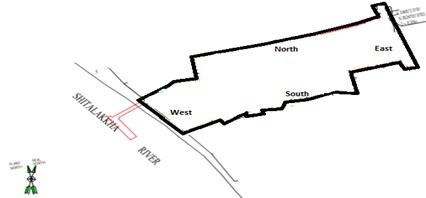
Data acquisition and experimental Set-up: Fig. 5 shows the developed the portable real time control system. In the factory, located next to Shitalakkha river, the system was operational in four different places for adequate amount of time to collect data (Fig. 6). Four places are marked as North, South, East and West according to the figure.
Fig. 6Mapping of the industry
a)
b)
5. Results
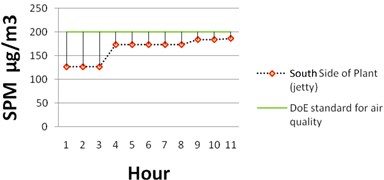
The in-house monitoring report said that that highest concentration of SPM occurred during the month of January and lowest in July. All of these indicated concentration level of SPM is lower than the DoE standards of 200 μg/m3. For the ambient Air Quality level, data were collected from different side locations (3-10 meter far from boundary) of the factory premises by the developed control system (Fig. 7-10). As observed, data from all the four sides were graphically analyzed. It was found that most of the time air quality was less than the border line. At the end of the working schedule, air quality tends to go towards the border line due to excessive work load. Therefore, it was proposed to give the workers a break of 20 minutes after 6 hours of hard working.
Fig. 7Air quality: West side of the industry with reference to DoE standard
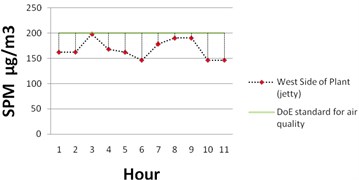
Fig. 8Air quality: East side of the industry with reference to DoE standard
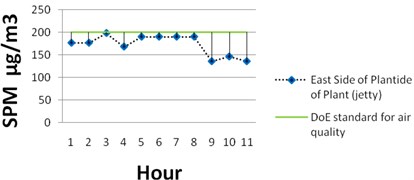
Fig. 9Air quality: North side of the industry with reference to DoE standard
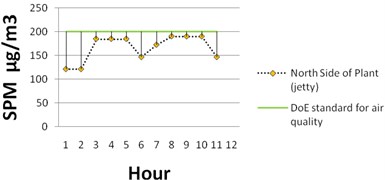
Fig. 10Air quality: South side of the industry with reference to DoE standard
Coming to the noise level, it was detected that noise and vibration were generated at the industry during construction and operational period due to the movement of vehicles; lorries; carrying, loading, and unloading of construction equipment and heavy machinery at the site; together with electrical and mechanical machines which were in operation during the data collection. Standard of industrial noise level in Bangladesh is described in comparison with maximum permitted duration in a day in Table 1. Hearing damage naturally is not often a result of an accident, unless someone happens to have a head injury. According to the outlined in the Noise Regulations, a more common problem is hearing loss which is the result of being exposed to noise levels above the exposure limits [12, 13]. Occupational Exposure Limits are described with a maximum permitted duration in Table 1.
Table 1Standard occupational exposure limits
Sound level (dB) | Maximum permitted duration (hours per day) |
85 | 8 |
90 | 4 |
95 | 2 |
100 | 1 |
105 | 2 |
110 | 1/4 |
115 | 1/8 |
Greater than 115 | 0 |
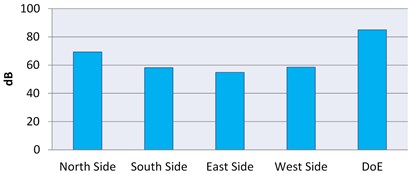
Table 2Ambient noise level: North-South-East-West side of the factory
Ambient noise quality analysis location | Date | Time | Sound level in dB | Remarks |
North side (10 m from boundary) | 31 Feb 2017 | 9 am-5 pm | 69.3 | Industry was running condition |
South side (5 m from boundary) | 31 Feb 2017 | 9 am-5 pm | 58.2 | Industry was running condition |
East side (5 m from boundary) | 31 Feb 2017 | 9 am-5 pm | 54.8 | Industry was running condition |
West side (3 m from boundary) | 31 Feb 2017 | 9 am-5 pm | 58.5 | Industry was running condition |
DoE Bangladesh standard for industrial area | 85 | |||
In this particular plant, the most sophisticated machineries had been installed, which produced a reduced amount of noise. For reducing noise level, the promoter already created a green belt around the factory building for which noise level could not exceed more than 85 db. The ambient noise level data were collected from different side locations of the factory premises by sound Level Meter and they are given below in Table 2. The ambient noise level data were collected from different side locations (3-10 meter far from boundary) of the factory premises as described in the table. As detected, data from all the four sides were tabulated and graphically analyzed (Fig. 11). It was established that most of the time sound level was less than the border line.
Fig. 11Graphical analysis of ambient noise level: North-South-East-West side of the factory
6. Conclusions
The result of industrial analysis of air quality and sound level monitoring of a specific cement factory in Bangladesh is environmentally acceptable. However, adequate and effective pollution prevention; abatement and control measure; proper and careful operation and maintenance; regular and effective environmental monitoring with adequate staff and budgetary provision; reporting to DoE should be ensured. It is expected that Cement factory in Bangladesh will follow all environmental compatible steps during construction, operation and maintenance period by which it sets a positive example as an environment friendly industrial unit. The objectives of this research have been successfully achieved. As a future work, the rest of the sensors could be made operational and the experiment should be taken place at different industrial premises in Bangladesh.
References
-
The Daily Star. The Highs and Lows. The Construction Sector Report, 2015.
-
Saniul Islam Cement Industry Overview in Bangladesh. SCRIBD, 2013.
-
Air Quality Resources, Concern for the Environment: air Quality in the Cement and Construction Industry, 2011.
-
Kenneth Casey D., Jose Bicudo R., David Schmidt R., Gay W., Richard Gates S. Air quality and emissions from livestock and poultry productions/waste management systems. Agricultural and Bio-system Engineering Publications, 2006, p. 361.
-
Bhanarkar A. D., Rao P. S., Gajghate D. G., Nema P. Inventory of SO2, PM and toxic metals emissions from industrial sources in Greater Mumbai, India. Atmospheric Environment, Vol. 39, Issue 21, 2005, p. 3851-3864.
-
Baroutian S., Mohebbi A., Goharrizi A. S. Measuring and modeling particulate dispersion: a case study of Kerman cement plant. Journal of Hazardous Materials, Vol. 136, Issue 3, 2006, p. 468-474.
-
Stacy Kika Cement Manufacturer to Pay $1.4 Million for Clean Air Act Violations. EPA United States Environmental Protection Agency, 2011.
-
Lenna Allen The Environment Aspects of the Cement Industry. 2013.
-
Grove: Sound Sensor User Manual. SEEED, 2015, http://www.mouser.com/catalog/specsheets/ Seeed_101020023.
-
Goudie A. S. Desert dust and human health disorders. Environment International, Vol. 63, 2014, p. 101-113.
-
Ising, Kruppa Health effects caused by noise: evidence in the literature from the past 25 years. Noise and Health, Vol. 6, Issue 22, 2004, p. 5-13.
-
Ambient, Outdoor, Air Quality and Health, Fact Sheet (Media Centre). World Health Organization (WHO), 2016, http://www.who.int/mediacentre/factsheets/fs313/en/.
-
Air Quality Guidelines for Particulate Matter, Ozone, Nitrogen Dioxide and Sulfur Dioxide, Global Update – Summary of Risk Assessment. World Health Organization (WHO), 2005. http://apps.who.int/iris/bitstream/10665/69477/1/WHO_SDE_PHE_OEH_06.02_eng.pdf.
About this article

