Abstract
The HPGe detector assembly of gamma-ray spectrometer cooled by Stirling cycle cryocooler is under consideration. Modal analysis based on the compiled dynamic model was carried out. The natural frequencies and modes shapes for HPGe detector with relative efficiency 15 % mounted by supports made from composite G-Etronax and CESTILENE HD 1000 were calculated by Solidworks simulation. The frequencies of the axial mode are in range of 200-600 Hz where electrical interferences caused by mechanical vibrations (so-called microphone noise) has a large impact on the resolution of spectrometer. It is shown that for cryostat cap the lowest natural frequencies determined by the thickness of input window lay in higher frequency range. The validity of the adopted model was confirmed by the experiments. The calculated natural frequencies of the detector assembly are compared to the harmonics of cryocooler’s vibration. The results obtained are useful to identify the interferences source in electrical circuits of spectrometer at its adjusting.
1. Introduction
The applying of High Purity Germanium (HPGe) detectors in Gamma-ray spectrometers assumes their cooling to cryogenic temperatures. The cooling by electromechanical Stirling cryocoolers has significant advantages over liquid nitrogen cooling especially for portable devices intended for field applications. However, mechanical vibrations inherent in Stirling cryocoolers are the reason of electrical noise induced at the preamplifier input. Mechanical vibrations cause small movements of both a HPGe detector itself and a cryostat cap around. The periodic variation of distance changes the structural capacitances between HPGe detector and components. In its turn the changes of the capacitances in input circuits of the preamplifier cause electrical interference. This microphone effect (the conversion of mechanical vibrations into electrical signals) reduces the final resolution of spectrometer [1-7]. Usually, to reduce the influence of microphone effect, the electronic methods are used. There are as follows – the applying of band pass filters in input circuits of preamplifier together with selection of the shortest shaping time or input circuits with two shaping times [1]. In some cases, the digital filters in subsequent blocks of spectrometric signal processing are applied [2]. It should be noted that electronic methods mentioned above do not provide a sufficient suppression of the microphone effect at the present time. To further reducing of microphone effect, more complicated for practical implementation methods of active vibration cancellation are used [4, 5].
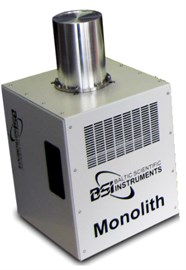
The spectrum of self-generated vibrations consists of a driving frequency and its harmonics due to cryocooler nonlinear dynamic characteristics, see for example [8, 9]. Electronic controllers used for modern cryocoolers allow to change operating frequency within the certain limits. This fact allows to avoid the coincidence between frequencies of cryocooler vibration and natural modes of detector assembly with the aim to decrease it vibration. Therefore, the modal analysis of detector assembly becomes important to reduce the microphone noise. The goal of this study is to estimate the resonance frequencies of HPGe detector assembly for gamma-ray spectrometer Monolith produced by Baltic Scientific Instruments company, Fig. 1(a).
2. The dynamic model of HPGe detector assembly
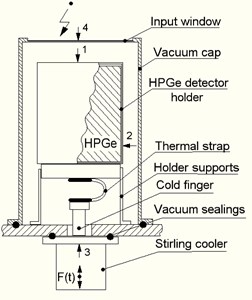
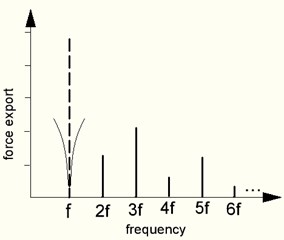
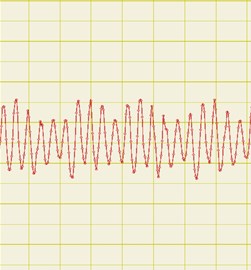
A typical design of a cryostat with HPGe detector and Stirling cryocooler is shown in Fig. 1(b). Two oscillatory systems, whose mechanical vibrations cause a microphone effect, can be distinguished. The first system is formed by a massive HPGe crystal placed into aluminum holder and mounted on rigid base of cryostat by supports having certain flexibility. The second system is formed by a thin-walled vacuum cap mounted on rigid base also. The parasitic capacitances between oscillatory systems are one of the reasons for microphone effect when they vibrate. For cooling, the HPGe detector holder is connected to cooler cold finger by means of a soft thermal strap. So, the main source of vibrations is cooler’s housing mounted on rigid cryostat base. Note that fixations of vacuum cap and Stirling cooler to base of cryostat are sufficiently rigid because they must provide necessary vacuum sealing. The operating frequency of Stirling coolers used in Monolith is in the range of 60 Hz to 100 Hz and typical Fourier spectrum of self-generated vibration in the axial direction is presented in Fig. 1(c). Vibration modes of cryostat components can degrade the resolution of spectrometer if they occur at inopportune frequencies.
It was noted that the greatest influence on the overall resolution of spectrometer has a vibration in the frequency range of 200-600 Hz. A significant vibration reduction at the driving frequency is usually provided by a tuned vibration absorber [8, 9]. The influence of vibration components with a frequency less than 200 Hz is rather small due to shortest shaping time for spectrometric signal processing. High-frequency vibration components have extremely low amplitude and are effectively suppressed by vibration damping.
Fig. 1a) Appearance of the gamma-ray spectrometer “Monolith”, b) typical design of HPGe detector assembly, c) Fourier spectrum of Stirling cooler’s self-generated vibration in the axial direction
a)
b)
c)
One of the main parameters of the HPGe detector is efficiency. It is characterized by the probability that an emitted gamma ray will interact with the HPGe detector and produce a count. High-efficiency detectors produce spectra in less time but have larger size and are more expensive. The determination of necessary efficiency is based on specific spectrometric tasks and is ordered by the Customer. So, the wide range of used HPGe detectors with mass-dimensional characteristics presented in Table 1. makes the problem for modal analysis relevant. The structure of HPGe detector assembly is axially symmetric. The most important is to determine the frequencies of axial modes, since in this direction the cryocooler vibrations are the greatest.
Table 1Mass-dimensional characteristics of holders with HPGe detectors used in Monolith
Relative efficiency of HPGe detector | 15 % | 20 % | 30 % | 50 % |
Diameter of holder with detector (mm) | 57 | 57 | 66 | 75 |
Height of holder with detector (mm) | 84 | 84 | 109 | 95 |
Mass of holder with detector (kg) | 0.78 | 0.92 | 1.12 | 1.46 |
3. The modal analysis of detector’s holder on supports
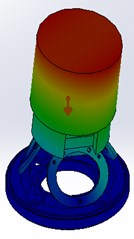
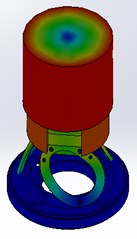
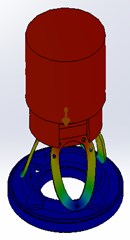
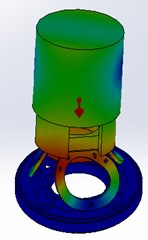
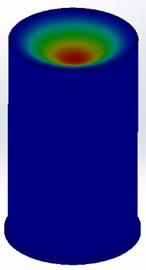
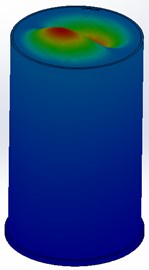
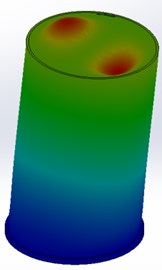
The computer simulations by Solidworks software for assemblies with various HPGe detectors and supports were carried out and natural frequencies of four lower modes were calculated. Its shapes are presented in Fig. 2. The lowest is the bending mode and the torsion and axial modes follow it. This sequence is typical for the structure of detector assembly shown in Fig. 1(b).
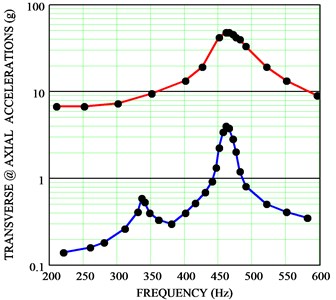
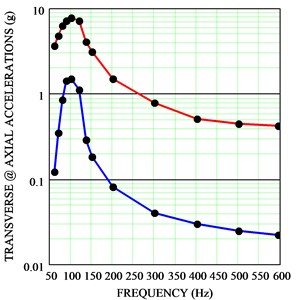
The assemblies based on HPGe detector with a relative efficiency of 15 % and supports made from composite G-Etronax and softer CESTILENE HD 1000 are considered below as example. Calculated natural frequencies are presented in Table 2. The results obtained by Solidworks simulation were compared with measurements on an experimental rig, shown in Fig. 3. The HPGe detector in holder on supports was fixed on a shaker. The frequency of vibration varied from 200 to 600 Hz, but the magnitude of forced acceleration remained constant and equals 2 g. The obtained responses of acceleration in the axial and transverse directions are shown in Fig. 4.
Fig. 2The lowest modes of detector’s assembly: a) and d) bending; b) torsion; c) axial
a)
b)
c)
d)
Table 2Natural frequencies and lowest modes of detector unit oscillations
Material of supports | 1-st mode | 2-nd mode | 3-rd mode | 4-th mode |
Bending | Torsional | Axial | Bending | |
Composite G-Etronax | 120 Hz | 406 Hz | 454 Hz | 679 Hz |
CESTILENE HD 1000 | 37 Hz | 105 Hz | 116 Hz | 155 Hz |
Fig. 3Experimental rig for detector holder response measurements
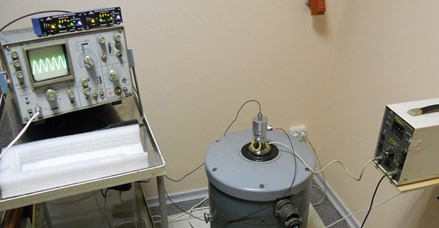
The vibration equipment УВЭ-1-004 was used to excite the investigated structure. Two KS76C accelerometers with axial sensitivity 100 mV/g and amplifiers M72A1 produced and calibrated by MMF company (Germany) were used. The weight of KS76C accelerometer was 23 grams, which was significantly less than the weight of holder with HPGe detector. The transverse sensitivity of accelerometer is less than 0.3 %. The accelerometers for axial and transverse vibrations measuring are placed on the holder in points 1 and 2, Fig. 1(b) and can be used for measurements in specified directions.
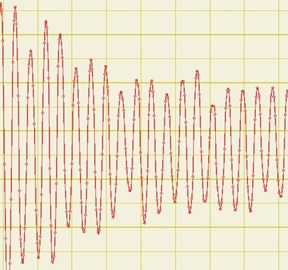
The resonant oscillations of holder on supports made from composite G-Etronax at frequency 460 Hz correspond to the axial mode, Fig. 4(a). Transverse oscillations with smaller magnitude are excited at the same range because of a small asymmetry of structure with mounted accelerometers. The magnitude increasing at frequency 340 Hz is caused by a nonlinear resonance at the half-frequency of bending mode with frequency 679 Hz. More elastic supports from CESTILENE HD 1000 provide the axial resonance at a lower frequency of 110 Hz, Fig. 4(b).
Fig. 4The resonance curves of holder vibrations in axial (red curve) and transverse (blue curve) directions: a) supports made from composite G-Etronax, b) CESTILENE HD 1000
a)
b)
4. The modal analysis of cryostat cap
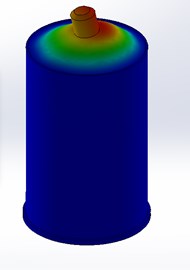
The typical aluminum cryostat cap, Fig. 1(b), has outer diameter 83 mm, height 153 mm, wall thickness 1.5 mm and thickness of input window 0.6 mm. The Solidworks simulation was performed and frequencies of lower modes are determined. The three lowest modes are presented in Fig. 5. There are two axial modes (1076 Hz and 2353 Hz) and bending mode (2379 Hz). The frequencies of the calculated modes are higher than the considered frequency range (200-600 Hz) and are depended mainly by the thickness of input window which is thinner than the walls of cap.
Fig. 5Cap modes: a) two axial 1076 Hz, b) 2353 Hz, c) bending 2379 Hz accordingly
a)
b)
c)
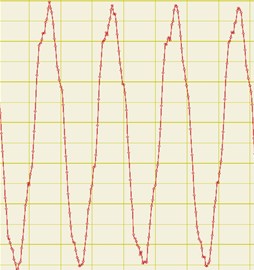
It should be noted that the weight of cryostat cap is only 180 g grams and for experimental testing it is necessary to take accelerometer’s weight into account when analyzing the obtained results. Its influence on the lowest mode when input window of cap oscillates is especially great. Therefore, the accelerometer was introduced into computer model of a cap, before experimental testing Fig. 6(a). For this case, the calculated frequency of axial mode decreased from 1076 Hz to 485 Hz. Further, on a fully assembled spectrometer, Fig. 1(a), the free vibrations of cap with mounted accelerometer were excited by a test hammer. The time history of accelerations on axial direction is presented in Fig. 6(b). The excited vibration corresponds to lowest axial mode and has a frequency of 465 Hz closed to calculated value. This fact confirms the validity of the calculated frequencies obtained on computer model.
Fig. 6The computer model of cap with accelerometer and time histories of accelerations on axial direction: b) damped free oscillations after shock excitation; frequency equals 465 Hz, c) forced oscillations on cooler flange (point 3 in Fig. 1(b); operating frequency equals 100 Hz, d) forced oscillations on input window of cap (point 4 in Fig. 1(b). Y-scale: 0.05g/div, and X-scale: 5 ms/div; marked time discretization is 0.2 ms
a)
b)
c)
d)
The time histories of vibration on axial direction excited by Stirling cryocooler used in spectrometer Monolith are presented in Fig. 6(c, d). The vibrations measured on the flange of cryocooler (point 3 in Fig. 1(b)) correspond to a driving frequency of 100 Hz. The amplitudes of the higher harmonics are small. On the contrary, in vibrations measured on the input window (point 4 in Fig. 1(b) the fifth harmonic of the driving frequency (500 Hz) has the largest amplitude. The amplitude of the main harmonic of 100 Hz is small. The time histories presented in Fig. 6(c, d) demonstrate the resonance amplification of the fifth harmonic having a frequency close to the lowest axial mode of the cap with accelerometer (465 Hz). The digital analyzer ZET 110 with software ZetLab were used for experimental testing. The results presented in Fig. 6 are valid if accelerometer is mounted on cap. In reality modes of cap oscillations shown in Fig. 5 exceed the frequency range under consideration.
5. Conclusions
Modal analysis of the HPGe detector assembly based on the compiled dynamic model was carried out. The natural frequencies and modes shapes for HPGe detector on supports and for cryostat cap were calculated by Solidworks simulation. The validity of the adopted dynamical model of detector assembly was confirmed by experiments. The greatest attention should be given to the vibration modes of the holder with HPGe detector on supports. The resonant oscillations of the cryostat cap are above the frequency range in which the appearance of a microphone effect has a maximal influence on the resolution of gamma-ray spectrometer.
The performed modal analysis of detector assembly makes it possible to determine the frequency ranges with undesirable resonance phenomena. Modern controllers for cryocoolers allow changing a driving frequency within certain limits with the aim to avoid the coincidence of its harmonics with the resonant frequencies of detector assembly.
References
-
Hasebe N., Shibamura E., Miyachi T., et al. Gamma-ray spectrometer (GRS) for lunar polar orbiter Selene. Journal Earth, Planets and Space, Vol. 60, Issue 4, 2008, p. 299-312.
-
Schultz M. K., Keyser R. M., Trammell R. C., et al. Improvement of spectral resolution in the presence of periodic noise and microphonics for hyper-pure germanium detector gamma-ray spectrometry using a new digital filter. Journal of Radioanalytical and Nuclear Chemistry, Vol. 271, Issue 1, 2007, p. 101-106.
-
Barton P., Amman M., Martin R., Vetter K. Ultra-low noise mechanically cooled germanium detector. Nuclear Instruments and Methods in Physics Research Section A: Accelerators, Spectrometers, Detectors and Associated Equipment, Vol. 812, 2016, p. 17-23.
-
Keyser R. M., Bingham R. D., Twomey T. R. Improved performance in germanium detector gamma-spectrometers based on signal processing. Journal of Radioanalytical and Nuclear Chemistry, Vol. 276, Issue 3, 2008, p. 567-575.
-
Namba T., Inoue Y., Moriyama S., Minowa M. An X-ray detector using PIN photodiodes for the axion helioscope. Nuclear Instruments and Methods in Physics Research Section A: Accelerators, Spectrometers, Detectors and Associated Equipment, Vol. 489, Issues 1-3, 2002, p. 224-229.
-
Hassan A., Torres Perez A., Kaczmarczyk S., Picton P. Active vibration control for a free piston Stirling engine generator using a voice coil actuator. Modern Machinery Science Journal, 2015, p. 547-554.
-
Johnson W., Long R., Nelson M., Mascarenas D. Embedded active vibration cancelation of a piston‐driven cryocooler for nuclear spectrometry applications. Proceedings of the International Modal Analysis Conference, California, 2012, p. 377-384.
-
Johnson D. L., Mckinley I. M., Rodriguez J. I., et al. Characterization testing of the thales LPT9310 pulse tube cooler. International Cryocooler Conference, 2014, p. 115-124.
-
Veprik A., Vilenchik H., Riabzev S., Pundak N. Microminiature linear split stirling cryogenic cooler for portable infrared applications. International Cryocooler Conference, 2007, p. 105-115.
About this article

