Abstract
Vibratory fatigue has been indicated to be one of the most frequently encountered problems in engineering practice. And it is inevitable that the mechanical components of machine are excited by random signals. Most of the random vibrations in nature contain non-Gaussian components. In order to reduce the failure and economic losses which is caused by vibration, random vibration testing is usually conducted in laboratory to verify whether the components can survive a particular random vibration or to identify weaknesses of items. In this paper, the vibratory fatigue damages of Gaussian random signals and non-Gaussian random signals to a particular system are discussed. The process and difference are illustrated by using a case study.
1. Introduction
Normally, it is inevitable that the mechanical components of machine are excited by random signals in field [1]. And vibratory fatigue has been indicated to be one of the most frequently encountered problems in engineering practice [2]. In order to reduce the failure and economic losses which is caused by vibration, random vibration testing is usually conducted in laboratory to verify whether the components can survive a particular random vibration or to identify weaknesses of items. But the study has illustrated that the signal measured in field environment is non-Gaussian vibration, especially in the road transportation domain [3]. W. H. Connon and D. Charles points out that when vehicles are running on irregular roads, the random excitation placed on vehicles is often non-Gaussian. However, the most random vibration excitation in laboratory is modeled as Gaussian process conventionally. When the probability density function (PDF) is taken into consideration, it is obvious that the characteristic described by kurtosis and skewness between Gaussian signals and non-Gaussian signals are different. Skewness is used to describe the extent that the peak of the probability density function (PDF) deviates from the mean value. The kurtosis is introduced to describe the overall shape of a probability density function (PDF) and is the main variable used to identify the differences from Gaussian signals to non-Gaussian signals. In this paper, the kurtosis is only considered to identify the differences from Gaussian signals to non-Gaussian signals. The PDF of Gaussian signal is constant and the value is equal to 3. While compared to Gaussian signal, the probability density function (PDF) of non-Gaussian signal with kurtosis greater than 3, wider on both sides of the tail and the tail value is larger than the Gaussian signal, is called super-Gaussian signal. Non-Gaussian signal whose kurtosis is less than 3 is called the sub-Gaussian signal, the probability density function on both sides of the tail is narrower and the tail value of the signal is smaller in terms of Gaussian [16]. The results show that most of the fatigue damage is mainly caused by the amplitude between 2 and 4 [9]. Compared to Gaussian signal the tail of measured data’s PDF is wider and the middle is sharper [4],which will lead to totally different accumulated fatigue damage because most fatigue damage is caused by 2 to 4 [5].
In this paper, the fatigue damages of Gaussian random signals and non-Gaussian random signals to a particular system under two vibrational inputs are discussed. No matter the two inputs are Gaussian random signals and non-Gaussian signals, the rain flow counting method is used to count the fatigue. The process and difference are illustrated by using a case study.
2. Non-Gaussian signal
Gaussian stochastic process is defined as the amplitude , and the PDF is shown as:
where, the mean and the standard deviation are functions of time t.
If a Gaussian process is ergodic, the mean and the standard deviation are constant to the variable and the amplitude PDF function is completely determined by and . The Eq. (1) can be simplified as:
Just the zero-mean Gaussian process is considered because a nonzero mean Gaussian signal can be obtained from a zero-mean Gaussian signal. When a Gaussian process has a zero mean value and is ergodic, the PDF of the instantaneous values that are realized over a long period of time is:
where is standard deviation. And can be given by:
According to Pasval’s theorem [15], for large durations , the variance is:
where is the single-sided PSD. And It shows that PDF function of the zero mean Gaussian stochastic process can be fully determined, which means that the zero mean Gaussian stochastic process can be completely described by the PSD function.
The second-order or higher-order statistics are called higher-order statistics. One useful method to establish how well a random process can be described by the higher order moments of Gaussian distribution computed. The higher-order statistics of the Gaussian distribution can be calculated by the second order moment as [18]:
When it comes to non-Gaussian process, the higher order moments of the process defined as:
According to Eq. (7), the mean value which is equal to can be calculated by:
When the mean value is zero, the variance is:
It is difficult to find the definite distribution function to describe the amplitude probability distribution of non-Gaussian random signal [19, 20]. In order to quantitatively characterize non-Gaussian process, the normalized third order moment called skewness and the normalized fourth order moment called kurtosis are usually used [16]:
where is the skewness and is the kurtosis.
Only the third order moment and the fourth order moment are considered in this paper. For a strictly Gaussian distributed signal, the skewness is 0 and the kurtosis is 3. Any deviation from these indicates that the process is non-Gaussian [21, 22]. From the perspective of simulating non-Gaussian vibration, kurtosis is a more important parameter than skewness, because it represents the probability of peak values in time history.
3. Numerical case study
In the following section, a case is used to compare the damage of a multi-degree-of-freedom system excited by Gaussian signal and measured non-Gaussian signal, respectively. In this paper, two input signals are taken as examples. The measured Gaussian signals and the Gaussian signals with the same PDF values are taken into account to compare the damage of the simulated multi-degree-of-freedom system. In Fig. 1, a measured non-Gaussian random signal whose kurtosis value is 7.3605 and the Gaussian signal transformed from the measured non-Gaussian random signal are shown.
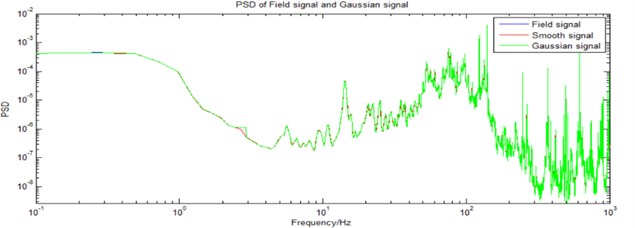
The measured random signal can hardly be simulated by ordinary random vibration controller because the kurtosis equals 7.3605. The damage calculated from the measured non-Gaussian signal is compared to the damage computed from Gaussian signal, which have the same PSD. In order to obtain the damage calculated from Gaussian signal whose PSD is the same to the measured signal. PSD of the field data is calculated using pwelch method with 8192 points hanning window. Gaussian signal is generated using a smoothed PSD (see Fig. 2). Red line is the smoothed PSD from the field signal’s PSD (blue line). The PSD of Gaussian signal, which is synthesized from smoothed PSD, is shown as green line (see Fig. 2). The PDF of field data and synthesized Gaussian signal with the same mean value and variance are shown in Fig. 2.
Fig. 1Field signal
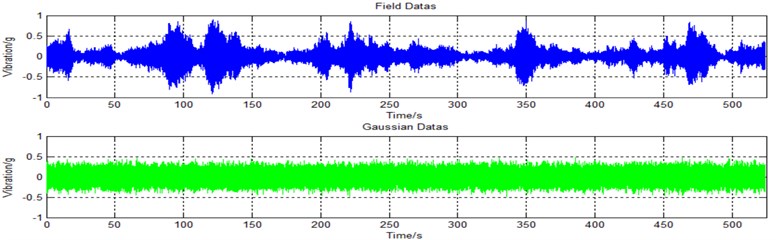
Fig. 2PDF of synthesized Gaussian signal
When the structure is subjected to vibration, we can begin to undertake the fatigue analysis of the structure if the weak point of structural and available fatigue theory has been determined. It is known that the structural weak point vibration response and structural fatigue theory is necessary to analyze the structure fatigue. In this paper, the field device is simulated as a four-degree-of-freedom system (as Fig. 3) for vibration fatigue analysis, and the parameter is shown as Table 1. It is assumed that the device is excited by two random vibration signals in the field environment. The inputs are working on , and is the weakest point.
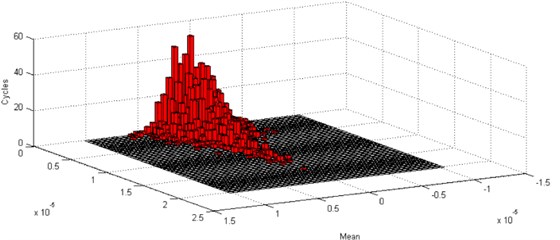
The response on of the system can be computed when the inputs applied on and are field data and synthesized Gaussian signal, respectively (see Fig. 3). For a structure, when the vibration response is available, the fatigue life can be evaluated according to the fatigue theory. According to the above-mentioned response, it is analyzed by rain flow counting method. The result when the input is Non-gaussian signal is shown as Fig. 4. And the result when the system is excited by synthetic gaussian signal is described as Fig. 5. It is obvious that the response of Non-gaussian signal will generate greater damage.
Fig. 3Four-degree-of-freedom system
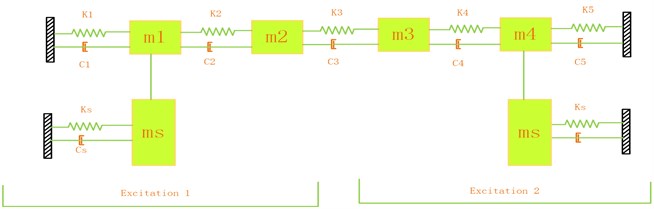
Table 1The parameter of the system
Parameter | Values | Unit |
10 | kg | |
3 | kg | |
8 | kg | |
15 | kg | |
50 | kg | |
, , , , | 10000 | N/m |
100000 | N/m | |
, , , , | 10 | Ns/m |
50 | Ns/m |
Fig. 4Damage analysis of non-Gaussian random vibration
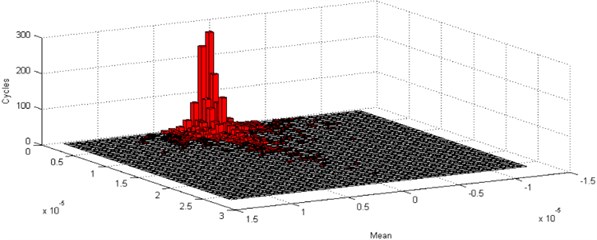
Fig. 5Damage analysis of Gaussian random vibration
4. Conclusions
In this paper, the fatigue damages of Gaussian random signals and non-Gaussian random signals to a particular system under two vibrational inputs are discussed. As what can be seen in the case, it is not difficult to find that the fatigue damage of the non-Gaussian signal to the multi-degree-of-freedom system exceeds the fatigue damage of the Gaussian signal.
References
-
Smith C. L., Chang J. H., Rogers M. H. Fatigue reliability analysis of dynamic components with variable loadings without Monte-Carlo simulation. Proceedings of the 63rd American Helicopter Society International Annual Forum, Virginia Beach, 2007, p. 1-11.
-
Thies P. R., Johanning L., Smith G. H. Assessing mechanical loading regimes and fatigue life of marine power cables in marine energy applications. Proceedings of IMechE, Part O: Journal of Risk and Reliability, Vol. 226, Issue 1, 2012, p. 18-32.
-
Smallwood D. O. Generating non-Gaussian vibration for testing purposes. Sound and Vibration, Vol. 39, Issue 10, 2005, p. 18-24.
-
Iii W. H. C. Comments on kurtosis of military vehicle vibration data. Journal of the Ies, Vol. 34, Issue 6, 1991, p. 38-41.
-
Lambert R. G. Fatigue life prediction for various random stress peak distributions. Shock and Vibration Inform, Center The Shock and Vibration Bulletin, 1982.
-
Smallwood D. O. Generating non-Gaussian vibration for testing purposes. Sound and Vibration, Vol. 39, Issue 10, 2005, p. 18-23.
-
Steinwolf A. Shaker simulation of random vibration with a high kurtosis value. Journal of the Institute of Environmental Sciences, Vol. 40, Issue 3, 1997, p. 33-43.
-
Steinwolf A. Random vibration testing beyond PSD limitations. Sound and Vibration, Vol. 40, Issue 9, 2006, p. 12-21.
-
Shen K. On the relationship between component failure rate and stress-strength distributional characteristics. Microelectronics Reliability, Vol. 28, Issue 5, 1988, p. 801-812.
-
Steinwolf A. Shaker simulation of random vibration with a high kurtosis value. Journal of the Iest, Vol. 40, Issue 3, 1997, p. 33-43.
-
Rouillard V., Lamb M. On the effects of sampling parameters when surveying distribution vibrations. Packaging Technology and Science, Vol. 21, Issue 21, 2008, p. 467-477.
-
Crandall S. H. Non-gaussian closure for random vibration of non-linear oscillators. International Journal of Non-Linear Mechanics, Vol. 15, Issue 4, 1980, p. 303-313.
-
Winterstein Steven R. Nonlinear vibration models for extremes and fatigue. Journal of Engineering Mechanics, Vol. 114, Issue 10, 1988, p. 1772-1790.
-
Ochi M. K., Ahn K. Probability distribution applicable to non-Gaussian random processes. Probabilistic Engineering Mechanics, Vol. 9, Issue 4, 1994, p. 255-264.
-
Polasek Wolfgang Time series analysis and its applications: with R examples. 3rd Edition. International Statistical Review, Vol. 81, Issue 2, 2013, p. 323-325.
-
Xu F., Li C., Jiang T., et al. Synthesis of running RMS-induced non-Gaussian random vibration based on Weibull distribution. Ciudad Y Territorio Estudios Territoriales, Vol. 4, 2016, p. 501-506.
-
Xu Fei Correlation analysis of PCB and comparison of test-analysis model reduction methods. Chinese Journal of Aeronautics, Vol. 27, Issue 4, 2014, p. 835-845.
-
Mendel J. M. Tutorial on higher-order statistics (spectra) in signal processing and system theory: theoretical results and some applications. Proceedings of the IEEE, Vol. 49, Issue 3, 1991, p. 278-305.
-
Rouillard V. On the non-Gaussian nature of random vehicle vibrations. Lecture Notes in Engineering and Computer Science, Vol. 2166, Issue 1, 2007.
-
Rouillard V. The synthesis of road vehicle vibrations based on the statistical distribution of segment lengths. 5th Australasian Congress on Applied Mechanics (ACAM 2007), Engineers Australia, 2007, p. 614-619.
-
Smallwood D. O. Generation of stationary non-gaussian time histories with a specified cross-spectral density. Shock and Vibration, Vol. 4, Issues 5-6, 1997, p. 361-377.
-
Smallwood D. O. Generating non-Gaussian vibration for testing purposes. Sound and Vibration, Vol. 39, Issue 10, 2005, p. 18-24.
About this article

