Abstract
In the current high degree of popularity of power products, power abnormalities on the production of more and more. Therefore, the prediction of power quality is of great significance. The method of prediction is generally to find the fitting function, the least squares fitting is the commonly used method to find the fitting function. In this paper, the least square method is used to fit the data of power grid. The factors influencing power quality were analyzed from four aspects, and the conclusions were obtained by fitting with real data points. In order to further improve the power quality prediction.
1. Introduction
Rapid developments in the energy industry have brought the studies on the quality of the power consumed to the fore. Power quality (PQ) has gained significance for energy providers and consumers recently. Undesirable situations that arise as a result of PQ problems affect much electrical hardware negatively. Also, poor power quality largely causes financial losses [1]. According to the European Power Quality survey report, PQ problems cause a financial loss of more than 150 billion Euros per year in the EU-25 countries [2]. Power quality (PQ) is generally defined as the combination of voltage quality and current quality which are used to identify the deviations from ideal waveforms of current and/or voltage. The ideal waveform of current and/or voltage is defined as the sinusoidal waveform with constant frequency and constant amplitude that are equal to their nominal values [3, 4]. With the advances in power electronics, signal processing, artificial intelligence and optimization in recent years, many researchers have contributed to the literature with remarkable studies on PQ in order to determine, identify and remove the deviations in ideal waveforms of current and/or voltage [5]. In this paper, least squares fitting method is used to predict the trend of power variation, so as to further improve the power quality forecasting method.
Identifying, storing and analysis of voltage disturbance data are very important in order best to understand the behaviors of power systems and improve PQ [6-8]. For this purpose, such signal processing approaches as Fourier transformation [9, 10], wavelet transformation (WT) [11, 12], Kalman filtering [13, 14] and -transformation [15, 16] are commonly used. The least squares fitting is one of the commonly used methods to find the fitting function, and it is widely used in practical engineering [17]. In this paper, we use the least squares fitting method to find the function relation in a large number of data. In principle, the least squares method is a traditional parameter estimation method, its basic requirement is to ensure that the value of the obtained function and the true value of the deviation between the square sum of the smallest. In practice, the use of least squares can be produced in the production of a large number of seemingly irregular data, and dig out a certain law, to fit into a curve to reflect the general trend of the data points, it is scientific research workers Provides a very convenient and effective method of data processing [18]. In the rapid development of computer science at the moment, the least squares method has been applied to various fields, power quality prediction in the field it will also play an important role.
2. Data description and experimental process
Power quality prediction is an important application of power quality analysis. Based on the existing data mining power quality changes in the potential law, to improve the quality of power distribution has a great effect. The data used in this study are the monitoring data of voltage qualification rate of urban power grid (52406) and the monitoring data of voltage qualification rate of rural power grid (379954). The data are recorded from October 1, 2015 to June 2016 30 days. Including the daily maximum value of the voltage, minimum, average, ultra-upper and lower limit of time, and the pass rate (pass rate is not a daily limit of the total run-time percentage of time) and so on.
To study the change model of power quality, we first select the indicators to evaluate the power status. According to the record data of power grid monitoring point, the qualified rate is selected as the index of power quality assessment. The qualified rate in the data represents the percentage of the total voltage in the rated voltage (including the voltage upper limit and voltage lower limit) in a day. If the overtime limit is 510 points and the lower limit time is 210 minutes, the voltage with a pass rate of 50 % (1440 points a day).
After determining the evaluation index, according to the principle of least squares to assume that the relationship between the two variables, for this study is to find the power quality (voltage qualified) and other voltage properties. The variables that are assumed to exist in the experiment are as follows:
1. The relationship between the current qualification and the qualification at the previous point in time.
2. The relationship between the pass rate and the average voltage of the day.
3. Pass rate versus time.
4. Relations with the passing rate of voltage levels.
According to the relationship between the variables in accordance with the least squares method to build the model, and verify the real data and 1 to build the model of the degree of fitting, if the high degree of fit is assumed to hold, and vice versa, does not hold. For 3, 4 because the data dissatisfaction with a year, the voltage level is only divided into five categories, it does not use the least squares fitting analysis, only based on data analysis of trend-assisted forecasting.
3. Result analysis
3.1. Power quality and time
First, from the power quality (bias pass rate) and the relationship between time to start. This assumes that the annual electricity consumption is cyclical (such as the annual peak is the annual electricity consumption), due to power quality affected by the electricity situation, it is also a cyclical change. The following is an analysis of the results of the study.
First, from the power quality (bias pass rate) and the relationship between time to start. This assumes that the annual electricity consumption is cyclical (such as the annual peak is the annual electricity consumption), due to power quality affected by the electricity situation, it is also a cyclical change.
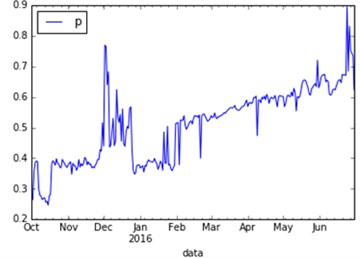
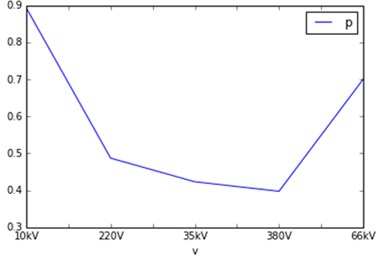
Fig. 1The trend of voltage qualification rate with time and voltage grade and voltage qualified rate
a)
b)
Build the line graph of the voltage passing rate of power grid with time, as shown in Fig. 1(a). Through the analysis, the change trend of qualified rate can be divided into two stages, that is, from October 2015 to February 2016 and February to June 2016, the overall trend of voltage qualification rate in the previous stage fluctuates from 0.4 to December out is a sudden surge in the peak to 0.8 and then back to 0.4. The latter stage of the overall upward trend, the voltage qualified rate climbed from 0.5 to 0.8. If the assumption is that the law can be used as a reference condition, the time for the analysis of electricity influence factors of quality.
3.2. Voltage qualification and voltage rating
Analysis of the relationship between voltage qualification and voltage level is to confirm the different voltage level of the voltage qualified rate of the existence of significant differences with the analysis of the same time if the voltage rating if the different voltage there are significant differences in the qualified power quality prediction can be assisted. As shown in Fig. 1(b) it can be observed that the pass rate does not change monotonically with the rise of the voltage level, but the difference of the average of the pass rates of different voltage levels has obvious influence on the prediction. 10 kV voltage level of which the highest average of the pass rate in the vicinity of 0.9, 380 V minimum average of 0.4, 220 V and 66 kV of the pass rate average of 0.5, 0.7 around.
3.3. Voltage qualification and voltage average
The average voltage is the most basic data of the grid, if you can predict the voltage quality will greatly improve the efficiency of the forecast.
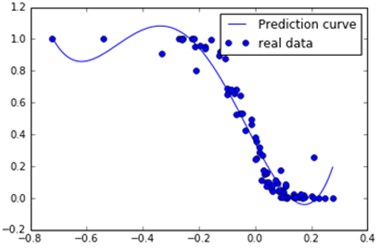
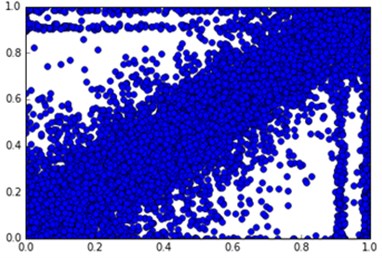
First of all, the data according to the least squares method to do binomial fitting, as shown in Fig. 2(a) (abscissa for the voltage average, the vertical axis voltage for the pass rate, the black point for the real data points, the blue line for binomial fitting). It can be seen from the image that although the fitting curve has a certain trend, it is not fitted with the real data points, and the distribution of the data points does not accord with any function class. This is due to the fact that the magnitude of the data is not uniform. Therefore, the data are classified according to the magnitude of magnitude, and normalized data, the average value of the size of the –1 to 1 interval, fitted as shown in Fig. 2(b). It can be found that although the data points are more concentrated at this time, the distribution is still not suitable for fitting.
Fig. 2Voltage qualification rate varies with voltage average
a) Overall
b) Normalized
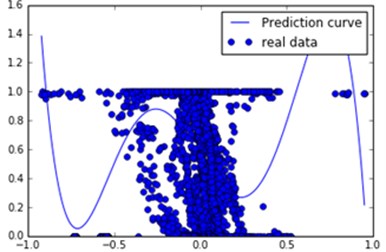
Since the results of the previous two-step analysis does not satisfy the requirements, the data are further divided into each monitoring point to obtain a large number of fitting images and fitting functions. It is found that some of the results are shown in Fig. 3. The qualification is concentrated around a constant value 1 in Fig. 3. Some results are shown in Fig. 4(a). Pass rate with the average voltage increases gradually decreased, the curve for the pentagonal fitting results. Part of the results shown in Fig. 4(b) the pass rate with the average voltage curve into a parabolic type, through the seven-type and the fitting curves of the obtained curve and the data distribution are high.
The results show that there is a relationship between voltage level and voltage average, but the relational model is not unique. Summary The relationship between qualification and average voltage can be categorized as the above-mentioned three types of line distribution: parallel line distribution (binomial fitting – Fig. 3), curve descent distribution (pentad fitting – Fig. 4(a)). Parabola-like distribution (seven-term fit – Fig. 4(b)). The latter two kinds of distribution are the majority, and the parabola distribution is more easily explained according to the meaning of the pass rate. When the bias voltage qualification rate is high, the voltage is distributed in the rated voltage (Fig. 4(b) parabola top). When the bias voltage qualification rate is low, the voltage is distributed outside the rated voltage (Fig. 4(b) parabola on both sides). According to the analysis, the voltage level can be used as an auxiliary indicator to predict the power quality. This contributes to the power quality analysis work.
Fig. 3The voltage qualification rate changes with the voltage average (monitoring point 1)
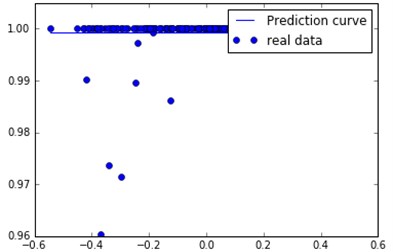
Fig. 4The voltage qualification rate varies with the average voltage
a) Monitoring point 2
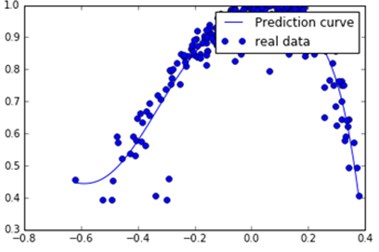
b) Monitoring point 3
3.4. Voltage qualification and voltage rating
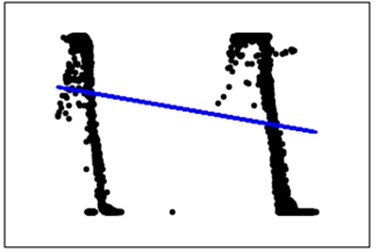
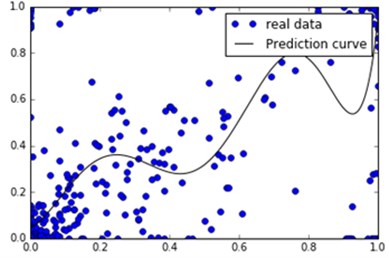
Finally, the relationship between the ‘’ the bias voltage qualification rate and the bias voltage qualification rate ‘’ – the input point (, ), for the day a pass rate, is y the day before the pass rate (For the convenience of description is called the bias voltage qualification of transfer). The overall data is analyzed by this rule, and the results are shown in Fig. 5(a). It can be seen that the pass rate of the whole data is positive correlation, and the binomial fitting coefficient is [0.88184171 0.04795697]. The following step-by-step analysis.
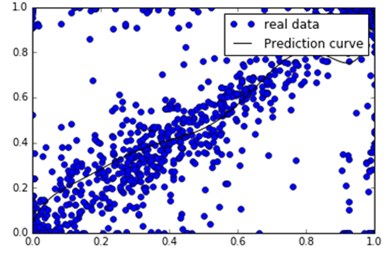
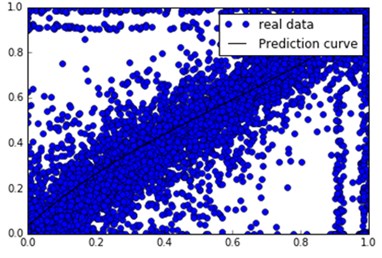
In the process of average voltage analysis, the pass rate of the monitoring points is analyzed. It should be noted here and not one by one analysis of monitoring points, but to five monitoring points as a unit, the first fitting into a unit, then every increase in a unit of observed changes in fitting. Fig. 5, Fig. 6 (from l top to bottom as a unit, 2 units, 10 units), when the input of a unit when the curve of the larger fluctuations in fitting. When lost the fitting curves of two units are relatively flat, and the diagonal data sets are more obvious. When entering ten the unit has no significant fluctuations in the polyline.
To sum up the analysis shows that the bias voltage qualification is a positive correlation, which is also consistent with common sense. When a regional power appear, problems will continue to have an impact on follow-up work. This indicates that the power quality can be predicted based on the bias voltage qualification rate, and use it to build the model
Fig. 5The relationship between the voltage bias and the voltage bias
a)
b)
Fig. 6The relationship between the voltage bias and the voltage bias
a) Two units
b) Ten units
4. Conclusions
By using the least squares method to simulate the monitoring data of power grid, it is found that the bias voltage qualification rate of the day before the voltage passing rate can be regarded as one of the predictions of the voltage qualification rate. Secondly, the mean value of voltage has a certain relationship with the bias voltage qualification rate, but the relationship model is not unique, there are three distribution models, such as parallel line distribution, curve descending distribution and parabolic distribution. Finally, there are obvious differences in the bias voltage qualification rate of different voltage levels, which can be regarded as one of the factors that affect the bias voltage qualification rate. If the annual power consumption is periodically changed, the time can also be used as one of the conditions of power quality prediction. Although these indicators are divided into primary and secondary, these indicators will be useful for future work on power quality analysis.
References
-
Uuml, Erişti S., Ouml, et al. Automatic recognition system of underlying causes of power quality disturbances based on S-transform and extreme learning machine. International Journal of Electrical Power and Energy Systems, Vol. 61, 2014, p. 553-562.
-
Manson J., Targosz R. European Power Quality Survey Report. 2008.
-
Morsi W. G., El-Hawary M. E. Power quality evaluation in smart grids considering modern distortion in electric power systems. Electric Power Systems Research, Vol. 81, 2011, p. 1117-1123.
-
Bollen M. H. J., Gu I. Y. H. Signal Processing of Power Quality Disturbances. 2005.
-
Erişti H., Yıldırım Ö., Erişti B., et al. Optimal feature selection for classification of the power quality events using wavelet transform and least squares support vector machines. International Journal of Electrical Power and Energy Systems, Vol. 49, 2013, p. 95-103.
-
Saini M. K., Kapoor R. Classification of power quality events – a review. International Journal of Electrical Power and Energy Systems, Vol. 43, 2012, p. 11-19.
-
Gaing Z. L. Wavelet-based neural network for power disturbance recognition and classification. IEEE Transactions on Power Delivery Vol. 19, 2004, p. 1560-1568.
-
Axelberg P. G. V., Gu Y. H., Bollen M. H. J. Support vector machine for classification of voltage disturbances. IEEE Transactions on Power Delivery, Vol. 22, 2015, p. 1297-1303.
-
Azam M. S., Fang T., Pattipati K. R., et al. A dependency model-based approach for identifying and evaluating power quality problems. IEEE Transactions on Power Delivery, Vol. 19, 2004, p. 1154-1166.
-
Santoso S., Grady W. M., Powers E. J., et al. Characterization of distribution power quality events with Fourier and wavelet transforms. IEEE Transactions on Power Delivery, Vol. 15, 2000, p. 247-254.
-
Gaouda A. M., Salama M. M. A., Sultan M. R., et al. Power quality detection and classification using wavelet-multiresolution signal decomposition. IEEE Transactions on Power Delivery, Vol. 14, 1999, p. 1469-1476.
-
Erişti H., Demir Y. A new algorithm for automatic classification of power quality events based on wavelet transform and SVM. Expert Systems with Applications, Vol. 37, 2010, p. 4094-4102.
-
Abdelsalam A. A., Eldesouky A. A., Sallam A. A. Classification of power system disturbances using linear Kalman filter and fuzzy-expert system. International Journal of Electrical Power and Energy Systems, Vol. 43, 2012, p. 688-695.
-
Prez E., Barros J. An extended Kalman filtering approach for detection and analysis of voltage dips in power systems. Electric Power Systems Research, Vol. 78, 2008, p. 618-625.
-
Suja S., Jerome J. Pattern recognition of power signal disturbances using S transform and TT transform. International Journal of Electrical Power and Energy Systems, Vol. 32, 2010, p. 37-53.
-
Chilukuri M. V., Dash P. K. Multiresolution S-transform-based fuzzy recognition system for power quality events. IEEE Transactions on Power Delivery, Vol. 19, 2004, p. 323-330.
-
Tian Shengben The statistical principle of least square method and its application in agricultural experiment analysis. Journal of Mathematics in Practice and Theory, 2015, p. 124-133, (in Chinese).
-
Zong Dianrui, et al. Application of least squares method. Journal of Qingdao University of Science and Technology: Natural Science Edition, 1998, p. 296-301, (in Chinese).
Cited by
About this article

