Abstract
We present a device built in fiber optic capable of detecting acoustic signals in water, using a buzzer as the vibration source, this buzzer operates at a frequency range from 3 kHz to 30 kHz. This device operates under the principle of a Sagnac interferometer, where the acoustic waves emitted by the buzzer are detected as a phase modulation in the monitored signal. The measured phase is due to strain experienced by the fiber optic which is caused by the vibrations emitted by the buzzer. The device can detect signals up to 7 cm away from the acoustic source.
1. Introduction
The acoustic wave detection through sensors in fiber optic is an attractive alternative method, because the fiber sensors can be extremely sensitive and, unlike established electronic technologies, they are immune to electromagnetic interference. In addition, they can be very compact, a key feature in applications such as oil-well monitoring where space is limited [1, 2].
As such, a hydrophone is simply a device for measuring sound in water [3]. A fiber hydrophone is an acoustic sensor using optical fiber as the sensing element. The most promising of these schemes are those based on optical interferometry [4, 5].
The Sagnac interferometer has been principally used to measure rotation. But its use can be extended to measure time-varying effects such as acoustics, vibration, and slowly varying phenomena such as strain [6]. The Sagnac interferometer particularly suitable for detection of underwater sound because the background acoustic noise in the ocean decreases with increasing frequency over a substantial frequency range [7]. The disadvantage is its poor low frequency responsivity, unless a very long fiber legth comprises the Sagnac loop [8].
2. Principle of operation
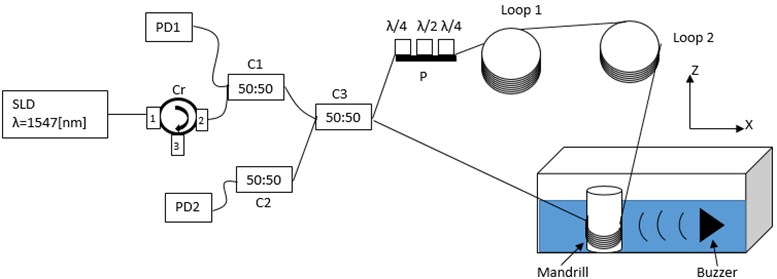
Fig. 1 shows the experimental sensor setup based on a Sagnac interferometer, this setup consists of a super-luminescent light source with a wavelength centered at 1547 nm, two delay loops (100 m and 80 m clockwise) and the detection element called mandrill. The sensing element is a can made of aluminum, with dimensions of 15.6 cm high, 1.02 mm thick and an external diameter of 5.65 cm, and a fiber optic segment is rolled around this can.
The light source has an output power of 22.2 mW which is splitted into two beams (this is done by the optical coupler C3, with a coupling rate of 50:50) and each one of these beams had the half of the original power. One of the beams propagates the signal in the clockwise direction while the other does in counterclockwise.
During the delay time between the beams in counter propagation to the sensor element, the acoustic signal from the buzzer reaches the mandrill and induces a phase modulation. This change in phase modulation is mapped to a phase difference between the two beams, which is converted into intensity modulation when the beams are recombined in the optical coupler C3. Hence, if an acoustic field of frequency induces a phase modulation on the mandrill, the resulting phase modulation between the interfering beams in the mandrill is given by [9, 10]:
where is the delay time between the arrivals of the beams to the mandrill.
Fig. 1Sensor schematic using a Sagnac interferometer. Cr (optical circulator), C1, C2, C3 (optical couplers 1, 2 and 3), P (optical polarizator), PD1, PD2 (photodiodes 1 and 2)
3. Experiments
In a test tank the mandrill is placed with 40 turns of optical fiber and is aligned to the acoustic source (buzzer) so that it is as close as possible and that the front of the acoustic wave affects the fiber winding. In addition, it is covered with water until the total of the turns, allowing that the interior of the mandrill this hollow, full of air of the exterior.
To generate the acoustic wave, an Agilent 33521A function generator was used to feed the buzzer with a continuous sinusoidal signal and an amplitude of 1 Vpp. The signal detected by the phase difference of the counter propagation beams is measured by the photodiodes, amplified 1000 times and visualized on a Tektronix TDS3034C oscilloscope.
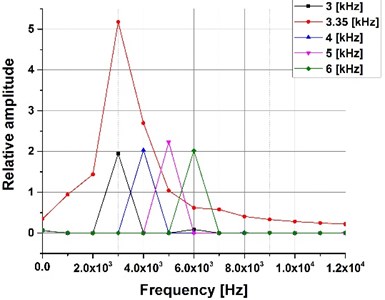
A first sweep in frequency from 3 kHz to 9 kHz was performed with increments of 1 kHz, determining the frequencies in which it obtains a greater amplitude (3-6 kHz), then, with a second sweep over that frequency range to increments of 10 Hz, the resonant frequency of the sensor device is obtained, which is 3.35 kHz.
Fig. 2Frequency sweep, excitation signal 1 Vpp
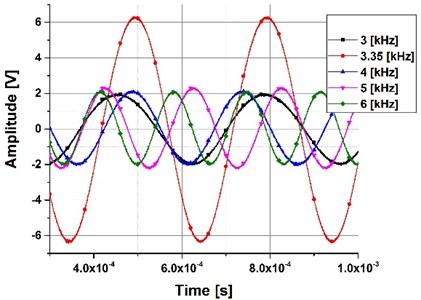
Fig. 3Spectral analysis, frequency range 3-6 kHz
Because the signal obtained was very small for frequencies above 9 kHz, the power supply to the acoustic source was increased to 10 Vpp and a frequency scan was performed from 10 kHz to 30 kHz, see Fig. 4.
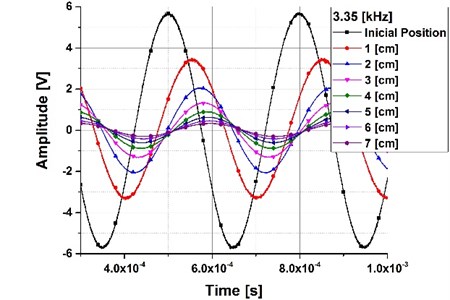
Once the resonance frequency was determined to be 3.35 kHz (see Fig. 2), a signal analysis is performed with respect to the distance at which the sensor source is separated from the sensing fiber (mandrill). For this purpose a mechanical positioning system based on stepper motors (Velmex) with a resolution of 2.5 μm per step was used. For the initial align, the sensor and the source were placed as much as possible (initial position), then 1 cm displacements were made on the axis up to 7 cm and the data of each of the measurements were captured for later analysis, in fig. 6 shows that the reference signal (initial position) is attenuated and shifted to the right as the source of the mandrill moves away.
Fig. 4Frequency sweep with an excitation signal of 10 Vpp
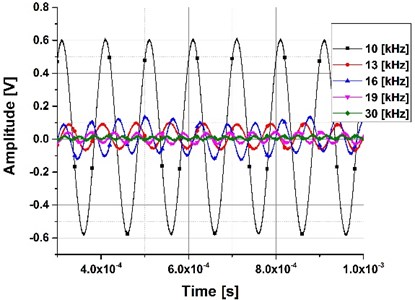
Fig. 5Spectral analysis with a frequency range from 10 to 30 kHz
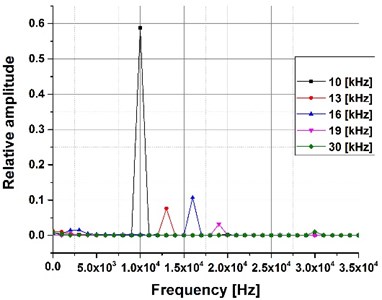
Fig. 6Displacement between the acoustic source and the sensor
4. Conclusions
It was demonstrated the implementation and characterization of a sensor in fiber optic for acoustic fields detection in water, with a frequency detection range from 3 kHz to 30 kHz also, from this frequency sweep it was found that at 3.35 kHz the sensor response with a greater amplitude. Additionally, it was observed that the sensor was able to detect the acoustic signal as the source and the mandrill were moved away, presenting an attenuation and offset respect to the initial position.
References
-
Jo W., Akkaya O., Solgaard O., Digonnet M. Miniature fiber acoustic sensors using a photonic-crystal membrane. Optical Fiber Technology, Vol. 19, Issue 6, 2013, p. 785-792.
-
Zujie F., Ken K., Ronghui Q., Haiwen C. Fundamentals of Optical Fiber Sensors. Wiley, 2012.
-
Hurrell A., Beard P. Piezoelectric and fibre-optic hydrophones. Ultrasonic Transducers, Materials and Design for Sensors, Actuators and Medical Applications. Woodhead Publishing, 2012, p. 619-676.
-
Yin S., Ruffin P. B., Yu F. T. S. Fiber Optic Sensors. 2nd Edition, CRC Press, 2008.
-
Morris P., Hurrell A., Shaw A., et al. A Fabry-Pérot fiber-optic ultrasonic hydrophone for the simultaneous measurement of temperature and acoustic pressure. The Journal of the Acoustical Society of America, Vol. 125, Issue 6, 2009.
-
Gholamzadeh B., Nabovati H. Fiber optic sensors. World Academy of Science, Engineering and Technology, Vol. 42, 2008.
-
Kråkenes K., Bløtekjær K. Sagnac interferometer for underwater sound detection: noise properties. Optics Letters, Vol. 14, Issue 20, 1989.
-
Knudsen S., Bløtekjær K. An ultrasonic fiber-optic hydrophone incorporating a push-pull transducer in a Sagnac interferometer. Journal of Lightwave Technology, Vol. 12, Issue 9, 1994.
-
Vakoc B., Digonnet M., Kino G. A novel fiber-optic sensor array based on the Sagnac interferometer. Journal of Lightwave Technology, Vol. 17, Issue 11, 1999.
-
Krohn D., Macdougall T., Mendez A. Fiber Optic Sensors: Fundamentals and Applications. SPIE Press, 2014.
About this article

This work was supported by DGAPA-UNAM through financing of Project PAPIIT IT101515. Besides we thank to Consejo Nacional de Ciencia y Tecnología (CONACyT) for its financial support in form of a Scholarship for the Master and Ph.D. Engineering Program at Universidad Nacional Autónoma de México.
