Abstract
Spare parts ordering is very important in the domain of system support based on condition-based maintenance. For a single-unit system with condition monitoring, a joint degradation and spare parts ordering model is established in this paper to achieve the lowest total cost rate as the objective. The degradation process of system is assumed to be followed a gamma process. A decision on optimal spare ordering time by the improved cost rate model based on the proposed degradation model is made. Finally, a case analysis is implemented to demonstrate the effectiveness of the proposed model in this paper. Analysis results show that the proposed model can reduce the cost rate effectively.
1. Introduction
Maintenance can be divided into corrective maintenance and preventive maintenance according to the different repair time. Preventive maintenance can be divided into planned maintenance and condition-based maintenance (CBM). CBM fully considers the degradation state of system and managers can make decisions based on the real degradation trend, thus avoiding the over-maintenance and downtime loss. Therefore, CBM is currently more popular maintenance type.
In current study of CBM, relevant research’s about degradation process and related maintenance decision-making have been mature [1, 2]. However, the research on decision of spare parts ordering based on degradation process is relatively few. Moreover, the literature about spare parts ordering rarely consider the degradation process of system. Zhang et al. [3] and Vander [4]have considered the optimization of spare parts allocation model with the cost as the constraint objective. Zhao et al. [5] also optimized the spare part allocation, using the improved spare part fill rate. For the single-component system with condition monitoring, Jiang et al. [6]made a joint decision for replacement and ordering of spare parts, which combined the classical joint strategy proposed by Armstrong et al. [7] and RUL prediction method with parameter adaptive estimation proposed by Si et al. [8]. In the above studies, there are few researches about the optimization of spare parts ordering, and the model is complex and difficult to realize the engineering application effectively.
Therefore, this paper focuses on the spare parts support model based on gamma degeneration process. The degradation threshold distribution of components is proposed by continuous state monitoring information. Through combining the classic joint strategy proposed by Armstrong et al. [7], the optimal spare parts ordering time is decided by the lowest total cost rate for maintenance.
2. Basic assumptions of the model
In general, the degradation trajectory of the system is different, but it can be summarized to find its degradation pattern. In order to facilitate the modeling analysis, the following assumptions are made:
1) Shortage cost rate and holding cost rate is fixed, expressed as and ;
2) The interval from spare parts ordering to the receipt of spare parts is fixed, expressed as ;
3) The initial spare parts inventory is zero;
4) The cost of spare parts is fixed;
3. Degradation and spare part ordering decision model
3.1. Degradation model
The degradation of system is denoted by . The degradation level of the system at time is represented by a random variable , assuming that the degradation in the initial state is zero, namely 0. It is assumed that is non-decreasing during degradation, the degradation threshold is . When , 0, the system is failure. The Gamma distribution can be used to describe a continuous cumulative wear process, which has all the properties needed to model the degradation process: non-negative, increased steadily and the growth process starts at zero [9]. In practice, the mean and variance of the degradation usually increases with time, so the following assumptions are made in the modeling:
It is assumed that the degradation process follows the Gamma distribution with mean and variance . The shape parameter of the Gamma distribution is , the scale parameter is , and the density function is , where is a Gamma function with mean and variance . Based on the above assumptions, the following density functions are obtained when calculating the degradation level at a given time :
At time , the distribution of degradation in [0, ] is:
Since it is necessary to determine the time to order the spare parts, the time distribution from [0, ] for a given degradation level is :
where is the probability density function of the time at which the degradation level is .
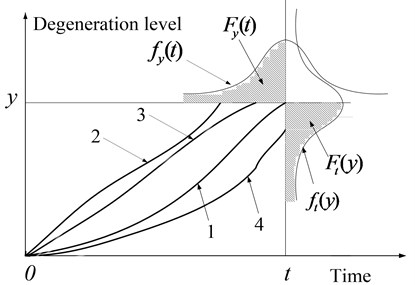
As the degradation trajectory of the system is uncertain, it can be classified into three categories, as shown in Fig. 1.
(1) At time , the degeneration level of the system reaches the degradation amount , as shown in Fig. 1;
(2) Before the time , the degeneration level of the system reaches the degradation amount, as shown in Fig. 1. At this time, the degeneration track of the system goes out from the line parallel to the abscissa axis when the degeneration amount is ;
(3) After the time , the degradation level of the system has not yet reached , as shown in Fig. 1;
(4) System still need to run for a period of time to reach the degradation level , the degeneration track of the system goes out from the line parallel to the longitudinal axis when the time is .
The summation of the probabilities of these three cases is equal to 1:
Taking the degradation distribution at time into (4), The time distribution can be drived when the degradation level is :
Fig. 1The relationship between Fyt and Fty
3.2. Cost model
When reaching the degradation threshold, the system need to be replaced, so we need to consider whether there are spare parts. It is assumed that the initial time of the cycle is the time when the new spare part is replaced and the ending time is the time when the system is fault and replaced again. As the failure time is uncertain, the length of the cycle is also uncertain. The purpose of this paper is to study the degradation pattern, predict the time when the system reaches the degradation threshold, and decide the time to order the spare parts to minimize the total cost rate. In the course of the cycle, there may be three cases, as shown in Fig. 2.
Fig. 2Schematic diagram of spare parts ordering time decision
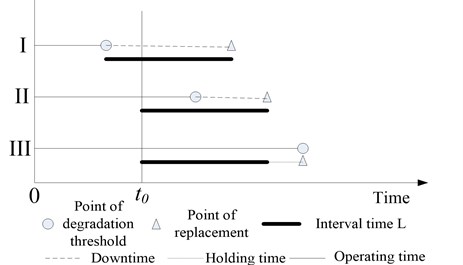
I. The system has reached the degradation threshold without ordering spare parts;
II. The spare parts have been ordered but the system has reached the degradation threshold when the ordered spare parts have not arrived;
III. When the system reaches the degradation threshold, there just have spare parts.
As seen in Fig. 2, the time to reach the degradation threshold is different, the costs incurred are also different.
Typically, once the system shutdown, the shortage costs will be very high, which is much higher than the spare parts holding costs, so .
The initial time is 0, order spare parts time is , the time from order to receipt of spare parts is . When the system reaches the degradation threshold in [0, ], ordering the spare parts immediately. When the system reaches the degradation threshold but not receives the spare parts, not re-orders, instead of waiting until the spare parts are replaced as soon as they arrive.
The expected shortage cost per cycle is:
If the system has not yet reached the degradation threshold at time , and the spare part has already arrived, the spare parts will need to be stored. The expected holding cost per cycle is:
where: .
The expected cycle length is:
The ordering cost rate function is:
Using this formula, we can get the suitable to get the lowest cost rate.
4. Case study
Considering the problem of spare parts ordering for critical systems, the system is expensive and needs to work continuously. Once the machine shutdown, it will cause significant economic losses. So, it is necessary to continuously monitor the condition of system. Once the degradation threshold is reached, the system need to be replaced. In this case, spare parts are required. If there are no spare parts to replace, shortage cost occurs. As the parts are expensive and expensive to keep, long-term storage of spare parts is not cost-effective, so they cannot be stored in large quantities for a long time. The best way is not to store spare parts, but at the right time to order the spare parts, so the spare parts arrive at the failure threshold of the system, thus letting the spare parts arrive when the component reaches the degradation threshold. This will result in no holding costs and no shortage costs.
It is known that the ordering price of the spare parts is fixed and not changed with the ordering time. The holding cost rate is RMB 300 Yuan/day, the shortage cost rate is RMB 10000 yuan/day, and the degradation threshold is 0.1. When the degradation amount reaches 0.1, the system is replaced. The time from order to receipt of spare parts is 30 days. From a large number of the part degradation data, 0.00025 / day, 0.02. Using these data into the proposed model, by the small step integration method for approximate calculation, the relationship between the order time and cost rate are obtained as shown in Fig.3
Fig. 3The relationship between spare part ordering time and cost rate
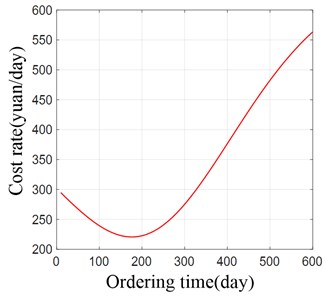
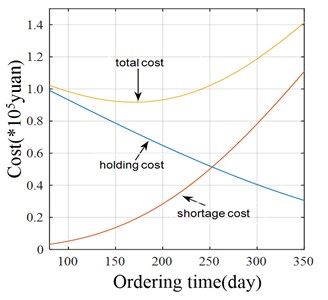
Fig. 4Costs curve
After the analysis of the data in the chart, the lowest cost rate is RMB 220 yuan/day, the best ordering time is to run 175 days, in which the cost rate is lowest.
Taking the data from 80 to 350 days with an increment of 10, the data is plotted as a graph in Fig. 4. It can be seen that the holding cost decreases with the delay of the order time, the shortage cost increases with the delay of the order time, but the total cost firstly decreases and then increases. From the Fig. 3. It can be seen that the cost rate also firstly decreases and then increase. The total cost and cost rate reach the lowest point almost at the same time, which is the results we actually expect. Through this case, it can be proved that in the practical application, using the model built in this paper to make the decision of spare parts ordering time can reduce the total cost and the cost rate in the process of spare parts storage and usage.
5. Conclusions
In this paper, we study the problem of spare parts ordering based on gamma degeneration process. The using time distribution under the arbitrary degradation amount is obtained. By establishing gamma-degenerate model for the system, the use time distribution of the arbitrary degradation level is obtained through calculation. Joint modeling of gamma model and improved cost rate model to decide the optimal spare part ordering time is built to obtain the lowest cost rate. Finally, the model is validated by case study. The results show that the model have practical value in the actual spare part ordering process, and ordering the spare parts at the decision time can reduce the total cost and make the cost rate the lowest.
References
-
Gu Hong-qiang, Guo Chi-ming, Zhao Jian-min Adaptive maintenance optimization for mechanical systems with non-stationary wiener degradation. AGJSR31 (Special Issue), 2013, p. 389-397.
-
Zhang Yingbo, Jia Yunxian, Feng Tianle, Qiu Guodong Remaining useful life prediction model of planetare carrier in helicopter main gear-box based on gamma degradation process. Journal of Vibration and Shock, Vol. 31, Issue 14, 2012, p. 47-51.
-
Zhang J., Zhang J. Fill rate of single- stage general periodic review inventory systems. Operations Research Letters, Vol. 35, Issue 4, 2007, p. 503-509.
-
Van der Heijden M. C. Near cost- optimal inventory control policies for divergent networks under fill rate constraints. International Journal of Production Economics, Vol. 63, Issue 2, 2000, p. 161-179.
-
Zhao Jianzhong, Li Haijun, Ye Wen, Wang Weihao Optimization configuration modeling of spare parts under constraint of improved system spare part fill rate. Acta Armamentarii, Vol. 34, Issue 9, 2013, p. 1187-1192.
-
Jiang Yunpeng, Guo Tianxu, Zhou Donghua Joint decision on replacement time and based on remaining useful life prediction. CIESC Journal, Vol. 66, Issue 1, 2005, p. 284-290.
-
Armstrong M. J., Atkins D. R. Joint optimization of maintenance and inventory policies for a simple system. IIE Transaction, Vol. 28, Issue 5, 1996, p. 415-424.
-
Si X., Wang W., Chen M., et al. A degradation path-dependent approach for remaining useful life estimation with an exact and closed-form solution. European Journal of Operational Research, Vol. 226, Issue 1, 2013, p. 53-66.
-
Jia Xisheng The Decision Models for Reliability Centered Maintenance. National Defense Industry Press, 2007, p. 116.
About this article
