Abstract
A novel procedure for the detection of the local damage in its early stage is proposed. The introduced methodology combines time-frequency decomposition via short time Fourier transform (STFT), -stable distribution modeling of the time series and application of appropriate measures of dependency towards time series. In contrast to classical methods, time series extracted from the time-frequency decomposition are treated as sample from the -stable distribution. Reason towards it is ability to model sub-signals from both informative and non-informative frequency bands with one type of the distribution. This approach provides a novel course to analyze signals with new methods, being generalization of classical ones. As a result of such approach, we obtain new time-frequency representation based on the classical via time-frequency decomposition with more visible informative frequency bands and lack of the undesirable effects of accidental impacts while acquiring signal. The presented methodology was applied to real data from the two-stage heavy duty gearbox used in mining industry.
1. Introduction
Local damage detection in vibration signal acquired from the heavy duty industrial machines is often a challenging problem. Such signal is often contaminated with noise resulting in low signal-to-noise ratio. Early stage local damage detection is important from both economical and practical point of view [1]. From economical point of view, it provides a way for relatively easy cost reduction. Scheduled investigations of machines are replaced with those based on the analysis of the algorithms output. From practical point of view, it allows for longer worktime of the components and reduced amount of parts replacements. Many researchers provide different approaches for the local damage detection. It can be denoted that those approaches prove to be effective using both novel procedures and modifications of already existing ones. One of the most known procedures for the selection of informative frequency band (IFB) in which information about the fault is placed, is kurtogram [2]. It provides a method for quick and precise IFB selection. Its extensions known as infogram [3], protugram [4] and sparsogram [5, 6] further develop ways to easily detect damage. One of the most interesting works in the field concerning IFB selection was performed using stochastic modeling of the sub-signals extracted from the time-frequency decomposition via STFT [7]. It proved to be as effective as methods based on the statistics and dyadic grids. However, alternative approach has emerged in the past years. It was proposed to model signals with impulsive behavior with heavy-tailed distribution, namely -stable one [8, 9]. It can be seen in the literature that ratio of works incorporating such approach is constantly growing. Most notable contributions towards local damage detection proved to be as effective as classical methods and more insensitive towards problems classical methods were coping with [10, 11]. In this paper we propose method based on time-frequency decomposition via short time Fourier transform which will allow us for modeling of sub-signals from narrow frequency bins. Further, each sub-signal is modeled with α-stable distribution as it can easily model time series from informative (impulsive behavior) and non-informative (non-impulsive) frequency bands. Having such model, one can denote that stability parameter for each sub-signal differs due to the behavior of time series. In IFB stability parameter will be significantly lower in comparison to the non-informative frequency band. Furthermore, on each sub-signal fractional lower order covariance is performed for increasing number of lags. In the last step, vectors of dependency based on the fractional lower order covariance are combined to form new time-frequency representation allowing one for easier IFB selection and local damage detection.
The paper is organized as follows. First section covers introduction and state of the art concerning application of the modeling of sub-signals from the STFT decomposition with heavy-tailed models. Second section contains methodology needed for the algorithm to be reproducible. In the third section one can find results of application of the algorithm towards vibration signal from the two-stage gearbox working in the heavy duty mining environment. Last section contains conclusions.
2. Methodology
In this section we present definitions concerning novel procedure of dependency maps.
In the first step one needs to perform time-frequency decomposition. In our case, we used short time Fourier transform due to its well-known properties and ease in application towards vibration signal. We define short time Fourier transform as [12]:
where is the shifted window and is the input signal ( 0, 1, 2,…, 1). Each sub-signal corresponding to appropriate frequencies can be treated as a time series, namely . Such decomposition allows one for detection of energy change through time in the certain frequency band. It is commonly known that vibration signal of the damaged component will possess impulsive behavior in the certain frequency bands. Such impulsive behavior is usually modeled with heavy-tailed distributions. One of the most known and frequently used is a generalization of Gaussian distribution, namely -stable distribution. Random variable has -stable distribution if it has following characteristic function [13]:
Here we shortly describe parameters from above equation.
• is stability parameter that belongs to (0, 2] interval and controls how heavy tails are. Heavy tail means extreme values will occur more often. If the is low, tails are heavier and more impulsive will be the random variable realizations.
• is the scale/dispersion parameter and is a positive number. It determines how much the distribution is spreaded around location parameter. When 2 it is equal to half the variance.
• is the location parameter and corresponds to the mean for from interval (1, 2] and to the median for from interval (0, 1].
• is the index of symmetry and belongs to the interval [–1, 1], with distribution being symmetric for 0.
In the next step we will use fractional lower order covariance as a measure of dependency for given frequency bin. Using approach of measuring dependency for given vector of lags one obtains vector of dependency. Combining such vectors for all frequency bins one obtains matrix of new time-frequency decomposition.
Gaussian distribution has well understood asymptotic tail properties. Namely they decay according to the exponential function, while α-stable distribution has tails decaying according to the power law, meaning distribution has heavy tails. Its properties are well-known and it reduces to the Gaussian distribution for certain value of the (2) stability parameter. In addition, moments higher than second are infinite for every value of the stability parameter. Second moment is finite only for the case when value of the stability parameter is equal to 2. It results in the nonexistence of the theoretical dependency measures. In the literature one can find alternative measures which do not use second moments, such as codifference and covariation. Most popular is covariation [14]. However, it is only defined for stability parameter being in [1, 2) range. In the last years rising trend for application of the fractional analysis has emerged. In this paper we will present application of one of the most promising measures.
Given process based on the -stable distribution, we apply to it fractional lower order covariance (FLOC) which is defined as [16]:
where is stability parameter of the -stable distribution and <∙> denotes operation as follows:
For realizations , , …, of the process there is:
which can be rewritten into easier form:
where is , is equal to signal length and is .
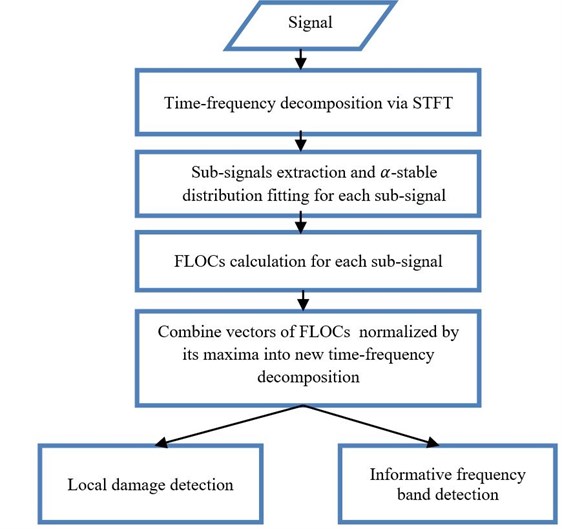
New time-frequency representation called FLOC dependency map is described in this paragraph. Let us assume that each sub-signal represents individual time series from certain frequency bin. Furthermore, one would like to know if there exists dependency at certain lag. One calculates FLOC for given number of lags for each sub-signal. Combining vectors of FLOCs normalized by its maxima into a matrix, creates new time-frequency representation. Normalization of each vector is required due to high energy in certain frequency bands. In Fig. 1 we present flowchart of the procedure with parameters and in Eq. (6) chosen to be 99 % of the maximum limit (2).
3. Real data analysis
In this section we will provide analysis of application of proposed method towards real data acquired from the system working in heavy industry environment. Gearbox comes from driving system used in belt conveyor, very popular technology, commonly used in mining industry for ore transportation. Measurements have been performed using commercial system. Parameters of data acquisition depend on the investigated object. In this case, they are as follows: duration 2.5 s, sampling frequency 16384 Hz, and the expected faults frequencies are 4.1 Hz and 16.5 Hz.
Fig. 1Flowchart of the procedure
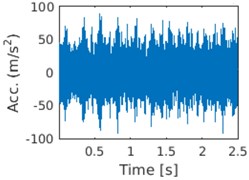
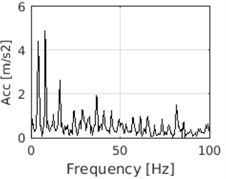
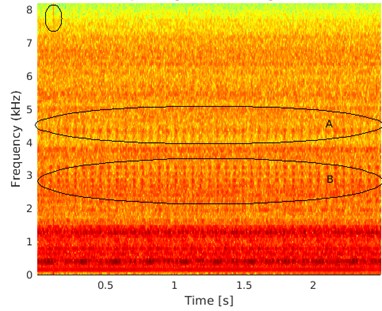
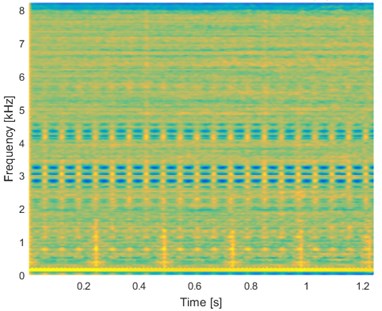
In Fig. 2 we present time waveform of the investigated vibration signal from the gearbox and its envelope spectrum. It can be seen that in the time domain there exists regular pattern of impulsive behavior. Moreover, in the right panel one can see fundamental frequency of the fault equal to 4.1 Hz and its few harmonics. However, second fault with frequency equal to 16.5 Hz is not visible in time or frequency domain. Following the steps of the procedure we perform STFT of the signal. In Fig. 3(a) one can see spectrogram of the signal. It can be seen that there exists few different areas in this representation. First, high energy area (marked with red color) is present in the low frequencies below 1.5 kHz. One cannot distinguish any particular behavior in this area. Second area is known as informative frequency band, around 2.5-3.5 kHz (area A) and 4-5 kHz (area B). In this area one can see impulsive behavior of the second fault (with frequency of the impulses equal to 16.5 Hz). Therefore, it is logical to model sub-signal from this area with the α-stable distribution. Other areas do not possess impulsive behavior however one can use the α-stable distribution as a generalization of the Gaussian distribution to model this sub-signal also. In the high frequencies one can see singular impulse related to the accidental impact on the case of the gearbox during signal acquisition. It is placed around 0.2 s of the signal duration.
Fig. 2a) Time waveform of the signal and b) its envelope spectrum
a)
b)
In the next step of the procedure one extracts sub-signals from the time-frequency decomposition. For each sub-signal -stable distribution is fitted by regression method [15]. It is done to adjust parameters and in Eq. (6) which will be set to be 0.992. Such choice of the parameters and is motivated by the fact that both must be lower than 2 and these values provide best results in this case. Moreover, it is done in such way to minimize number of parameters needed to be set manually and to avoid situation when one of the parameters would exceed value of . Moreover, we set number of lags to be equal to half the length of the sub-signal. Each vector of FLOC dependency measure is normalized by its maximum because of varying energy in different frequency bins. Combined map of normalized vectors is presented in Fig. 3(b).
It can be seen that new time-frequency representation presents new significant information in the signal analysis. One can clearly see IFBs from Fig. 3, right panel in which we have information about the fault with frequency 16.5 Hz. Moreover, one can denote that there is present additional information in the low frequency band, where previously was non-informative area. In this section one can see information about fault frequency equal to 4.1 Hz.
Fig. 3a) Spectrogram of the signal and b) normalized FLOC map
a)
b)
4. Conclusions
In the paper a novel procedure for enhancement of the time-frequency representation was presented. Method is based on the fact that impulsive signal can be modeled with heavy-tailed distribution, namely α-stable distribution. It should be mentioned, such distribution allows for modeling of signals from both informative and non-informative frequency band. However, other methods for measuring dependency are required. In this procedure we used fractional lower order covariance method. It provides accurate results with high precision and average computation cost. Additionally, in comparison to spectrogram, visibility of IFBs is significantly improved. Further development of this method and modifications can result in precise algorithm allowing for separation of the components responsible for each fault.
References
-
Zimroz R. Role of signal preprocessing in local damage detection in mining machines. Diagnostyka, Vol. 2, Issue 46, 2008, p. 33-36.
-
Antoni J. Fast computation of the kurtogram for the detection of transient faults. Mechanical Systems and Signal Processing, Vol. 21, Issue 1, 2007, p. 108-124.
-
Antoni J. Theinfogram: entropic evidence of the signature of repetitive transients. Mechanical Systems and Signal Processing, Vol. 74, 2016, p. 73-94.
-
Barszcz T., Jabłoński A. A novel method for the optimal band selection for vibration signal demodulation and comparison with the Kurtogram. Mechanical Systems and Signal ProcessingVol. 25, Issue 1, 2011, p. 431-451.
-
Tse P. W., Wang D. The design of a new sparsogram for fast bearing fault diagnosis: Part 1 of the two related manuscripts that have a joint title as “two automatic vibration-based fault diagnostic methods using the novel sparsity measurement – Parts 1 and 2”. Mechanical Systems and Signal Processing, Vol. 40, Issue 2, 2013, p. 499-519.
-
Tse P. W., Wang D. The automatic selection of an optimal wavelet filter and its enhancement by the new sparsogram for bearing fault detection: Part 2 of the two related manuscripts that have a joint title as “two automatic vibration-based fault diagnostic methods using the novel sparsity measurement – Parts 1 and 2”. Mechanical Systems and Signal Processing, Vol. 40, Issue 2, 2013, p. 520-544.
-
Obuchowski J., Wyłomańska A., Zimroz R. Stochastic modeling of time series with application to local damage detection in rotating machinery. Key Engineering Materials, Vol. 569, 2013, p. 441-449.
-
Nikias C. L., Shao M. Signal Processing with Alpha-Stable Distributions and Applications. Wiley, New York, 1995.
-
Chouri B., Aroussi M. E., Tabaa M., Jarrou A., Fabrice M., Dandache A. Bearing fault diagnosis based on Alpha-stable distribution feature extraction and wSVM classifier. 27th International Conference on Microelectronics (ICM), 2015, p. 277-280.
-
Żak G., Obuchowski J., Wyłomańska A., Zimroz R. Application of ARMA modelling and alpha-stable distribution for local damage detection in bearings. Diagnostyka, Vol. 15, Issue 3, 2014, p. 3-10.
-
Yu G., Li C., Zhang J. A new statistical modeling and detection method for rolling element bearing faults based on alpha-stable distribution. Mechanical Systems and Signal Processing, Vol. 41, Issues 1-2, 2013, p. 155-175.
-
Allen J. B. Short term spectral analysis, synthesis, and modification by discrete Fourier transform. IEEE Transactions on Acoustics, Speech and Signal Processing, Vol. 25, Issue 3, 1977, p. 235-238.
-
Samorodnitsky G., Taqqu M. S. Stable Non-Gaussian Random Processes. Chapman and Hall, New York, 1994.
-
Wyłomańska A., Chechkin A., Sokolov I. M., Gajda J. Codifference as a practical tool to measure interdependence. Physica A, Vol. 421, 2015, p. 412-429.
-
Koutrouvelis I. A. Regression-type estimation of the parameters of stable laws. Journal of American Statistical Association, Vol. 75, 1980, p. 918-928.
-
Qiu T., Li X., Sun Y., Wang H. Fractional lower order α-stable distribution and issues in its applications. Journal of Detection and Control, Vol. 26, Issue 2, 2004, p. 5-9.
About this article
