Abstract
There are many methods applied including Bayesian network and D-S evidence theory to cope with uncertainty involving aleatory uncertainty and epistemic uncertainty in reliability analysis of complex systems. This paper introduces theories of these two methods briefly, and then conversion rules that convert fault tree into Bayesian network under uncertainty are put forward, including AND node, OR node, XOR node, NOT node and Two-out-of-three vote node. Comparing to probability importance, structural importance and criticality importance, epistemic importance is given to measure the influence of root event to top event. At last, a type of engine is taken for example. Bayesian network model is established by referring to the fault tree of the engine, and D-S evidence theory is used to determine the belief functions and plausibility functions of uncertain nodes by data fusion. Weak nodes in reliability design and distribution are pointed out after reliability assessment, importance analysis, and backward reasoning. And corresponding measures can be taken to improve the reliability of the whole system.
1. Introduction
Reliability of a system, subsystem, or unit is defined in [1] as: the ability to perform its required functions under specific operating conditions for a specified period of time. Methods of traditional reliability analysis include fault tree analysis (FTA), failure mode effect analysis (FMEA), failure mode, mechanisms and effects analysis (FMMEA), failure mode effect and criticality analysis (FMECA) and Monte Carlo sampling (MCS). Traditional research mainly centers on the assumption that system or unit has only two states, i.e., normal and failure [2]. This is appropriate for some electrical units or precise instruments. However, in reality most systems consist of units with different parameters and various failure modes. According to different classification rules of traditional analysis models, states of these units are divided into normal or fault, which leads to a loss of important information, and results in correctness decreasing of reliability analysis. The development of Bayesian network, Markov model, Petri net, and Fractional Calculus theory promotes the research of reliability analysis in multi-states of complex systems and units.
In recent years, much more attention is paid to uncertainty in reliability assessment. Uncertainty is common in the life cycle of a product. In the stage of development, uncertainty involves design scheme, reliability distribution, material choices and corresponding parameters such as failure rate, stress, strengthen and useful life. In manufacturing, uncertainty includes technological process and related technical factors such as manufacturing techniques, management level and operating skills of workers. When it comes to the period of operation, uncertainty refers to operation environment, logistics conditions and maintenance strategies and modes including posterior maintenance, scheduled maintenance and condition-based maintenance. In addition, the whole procedure involves other uncertainty, such as cost effectiveness, completion rate, economic benefit and social benefit.
Uncertainty involves two aspects, aleatory uncertainty which reflects the inherent nature of things represented by probability model and epistemic uncertainty expressing subjective judgments of human because of lack of knowledge [3, 4]. Much epistemic uncertainty information from domain experts and technicists is added into system or unit state determination, failure mode classification and original parameter setting. As systems become more complicated and sophisticated, hostile operation environment demands high reliability, long life and good characteristic, which increases costs in design, manufacturing, and logistics support, especially for airplanes, rockets and missiles. Because of variable operation environments and lacking statistical data, we should take advantage of uncertain information, incomplete information and imprecise information from original data in reliability design, testing, evaluation and prediction.
There are many methods to deal with uncertainty in reliability analysis, such as Bayes theory, convex model, reliability theory, D-S evidence theory, interval analysis, and fuzzy probability theory. In fact, aleatory uncertainty and epistemic uncertainty exit in the same complex system at the same time, so when establishing a reliability model, we should combine them together [5, 6]. Bayesian network (BN) can not only convey uncertainty and correlations between events, also describe multi-state systems and uncertain logic relationships [7-9]. In addition, BN has an advantage in reasoning forward and backward. To enhance the ability of BN in tackling uncertainty, academic literature [10] implements Bayesian network with D-S theory to treat epistemic uncertainty and extract as most information as possible from existing data. And it sets a Bayesian framework for us to utilize evidential networks without further modification. Zhao et al. [11] modified BN by D-S evidence theory to evaluating the reliability of a power distribution system containing ambiguity and uncertainty. In literature [12], the authors introduce uncertainty into FTA and assess the reliability of a type of missile engine after establishing BN model.
In this paper, we will study further in uncertainty expression and data fusion based on D-S evidence theory to assess and analyze the reliability of a complex system. In Section 2, theories of BN and D-S evidence are explained briefly. In Section 3, uncertainty is introduced into FTA, and conversion rules of converting FT nodes into BN nodes are put forward. In Section 4, a case of an engine is taken for example. By using D-S evidence theory, expert opinions are converted into belief and plausibility functions, and then dealt along with uncertain reliability values. With the advantages of BN in reasoning and importance analysis, weak node is pointed out.
2. Basic theories of BN and D-S theory
2.1. Bayesian network
Compared to FTA [13-15], BN, developed on the base of probability and graph theory, has advantages in describing events of polymorphism and expressing uncertain logic relationships. Literature [15] offers detailed introduction about BN.
BN model is denoted as . represents a directed acyclic graph (DAG). are nodes and is the set of bow. describing CPT is denoted as . In directed edge , is father node, and is child node. The set of father nodes can be denoted as and other nodes can be denoted as . When is obtained, and are conditional independent, we can get [7, 16]:
And the joint probability of BN can be denoted as:
2.2. D-S evidence theory
D-S evidence theory is put forward by Dempster in 1967, and then modified by his student Shafer, so it’s also called Dempster Shafer theory.
The frame of discernment is the set of disjoint states or focal elements of . The function is defined as [17, 18]: verifying:
where is the basic probability assignment (BPA) on the frame of discernment representing the supporting degree of evidence to event
In D-S evidence theory, plausibility and belief functions play a role in gaining system failure information. The belief function is defined as : , by:
While the plausibility function is defined as : , , by:
The belief and plausibility functions determine the bounding of the probability, then:
According to the compositional rule of Dempster, for mass functions , , …, on the frame of discernment , we can obtain:
is the coefficient of friction between the evidence, denoted as:
3. Modifying Bayesian network with D-S evidence theory
3.1. BN node model under uncertainty
The main problem in constructing a Bayesian network model including establishing the topological structure and calculating the probability parameters, is knowledge acquisition. By so far, there are three methods in building a Bayesian network model. 1) By consulting experts in related domain and using experts’ experience knowledge, we can establish a Bayesian network model manually, and get CPT given by experts. 2) By using computers to reason from a large amount of data from the database, a Bayesian network model can be established automatically, and CPT can be obtained automatically. 3) Construct a Bayesian network model in two phases. By this method, a Bayesian network model is established in the circumstance of experts’ knowledge, and CPT is also given by experts. Then, the model is modified by the information in the database. In relatively, for some complex systems, especially new systems, information is so scarce that we can establish fault tree according to its inner structure, operation principle, failure mode and then convert it into Bayesian network model on the basis of failure mechanism analysis. Compared with traditional reliability analysis methods, BN model reduces the procedure of calculating minimal cut sets or minimal path sets, and bottom events appearing for more than one time can be denoted by one node.
In reliability analysis of complex systems under uncertain conditions, 0 is used to represent fault and 1 for normal, then denotes the uncertainty. In other words, an uncertain state is added to traditional binary state fault tree. In reliability analysis model, the frame of discernment is , if is the basic probability assignment function, the power set is:
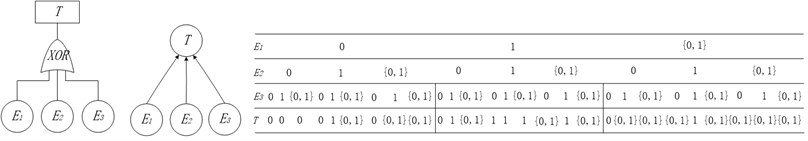
Basic probability assignment function is limited by Eqs. (3) and (4). Focal element represents that reliability analysis experts do not know whether event happens or not, which denotes the uncertainty. Fig. 1 shows the conversion process of AND node in fault tree into BN node. The state of top event is determined by bottom events and . Due to uncertainty, the top event will happen definitely only when bottom events and happen. If one of the bottom events does not happen, the top event will not happen. In other cases, it is uncertain whether top event will happen or not. According to the rules of logical gate of OR node, XOR node, NOT node and Two-out-of-three voting node, corresponding nodes in BN model under uncertain conditions are determined, shown in Fig. 2-5.
Fig. 1AND node in BN model
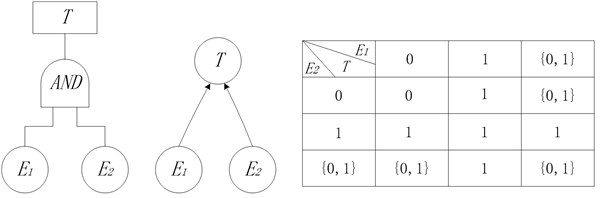
Fig. 2OR node in BN model
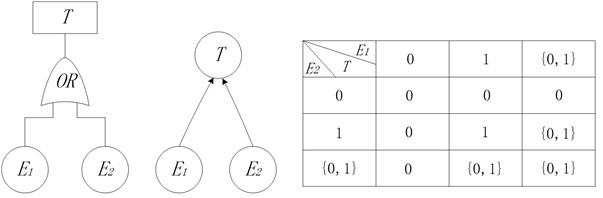
Fig. 3XOR node in BN model
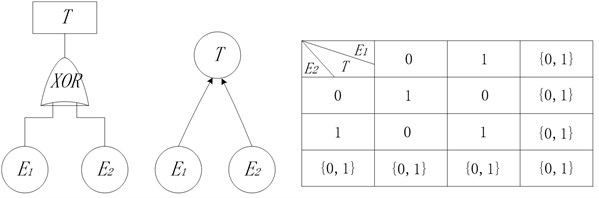
Fig. 4NOT node in BN model
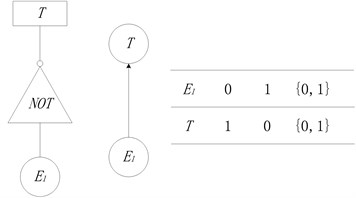
Fig. 5Two-out-of-three node in BN model
3.2. Modeling procedure
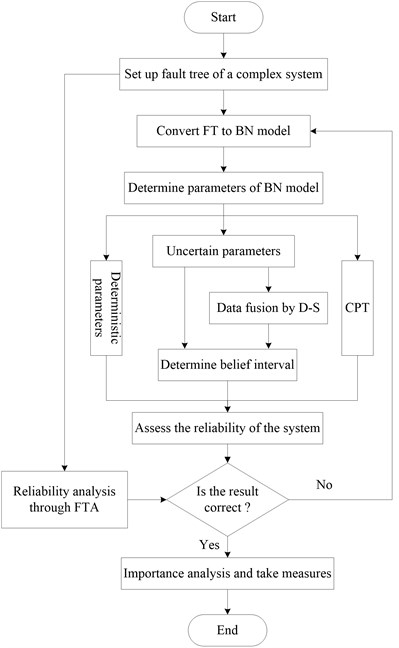
Data information from different sources can be fused through D-S evidence theory. And by taking use of the advantages of BN in uncertainty expression and reasoning, modified model of BN is established on the basis of data fusing. Firstly, by consulting experts and resourcing, fault tree of complex system is set, and according to conversion rules mentioned above, BN model is established. Secondly, determine parameters including deterministic parameters and uncertain parameters and CPT of BN model. For parameters having only one data source, belief and plausibility functions can be determined directly by D-S evidence theory. For parameters having lots of data sources, the compositional rule of Dempster is applied to data fusion, belief and plausibility functions are determined according to uncertain parameters. Thirdly, assess the reliability of complex system using parameters determined, and compare the result with value obtained through traditional reliability analysis to judge the correctness of BN model. If the result is not satisfied, adjust the nodes or modify the parameters. Lastly, find weak node through importance analysis and then take some corresponding measures. The modeling procedure is shown in Fig. 6.
3.3. Importance analysis
By Bucket elimination algorithm, it’s easy to calculate three kinds of importance indexes of bottom event in BN model.
1) Probability importance:
2) Structural importance:
where .
3) Criticality importance:
Because of the existing of uncertainty, the bottom event has three states, i.e., , , . Except the structural importance is a constant, the other two are interval values. So, we can define the mean value of the belief and plausibility functions as their constant value:
4) Epistemic importance.
To reflect the influence of uncertainty on system reliability assessment comprehensively, epistemic importance is put forward. Epistemic importance is an index to measure the influence of epistemic uncertainty in bottom event on the uncertainty of top event, which is defined as the difference value between belief function and plausibility function of top event when the epistemic uncertainties of other bottom events are 0:
where , ,
Fig. 6Modeling procedure of BN model modified by D-S theory
4. A case study
4.1. Setting up a fault tree
A certain type of engine consists of two electric detonators, an ignition signal, a seal ring, a power grain and the shell [12]. Because of its complex structure, a fault tree model is set up, shown in Fig. 7, based on the logical relationship of series-parallel connection which reflects the function of system and all parts and their interactional relationship. Details of events are listed in Table 1.
Fig. 7Fault tree of a type of engine
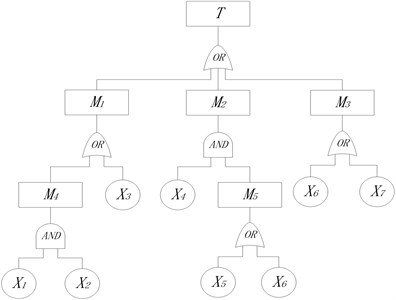
Table 1Details of events in fault tree
Event | Meaning |
Failure of engine | |
Failure of ignition | |
Explosion of shell | |
Burning through of shell | |
Failure of electric detonators | |
Too high of pressure | |
Failure of electric detonator 1 | |
Failure of electric detonator 2 | |
Failure of ignition signal | |
Failure of shell | |
Crack of grain | |
Debonding of coating layer | |
Failure of seal ring |
Obviously, the minimal cut sets of fault tree of the engine are , , , and So the failure rate of top event is determined by:
4.2. Building up BN model
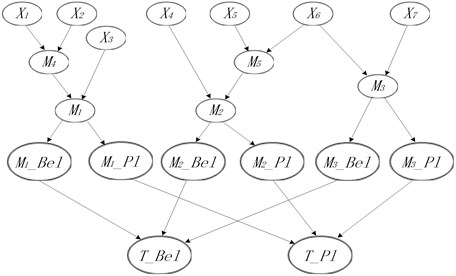
According to conversion rules introduced in Section 4, BN model of the engine is established by using software GeNIe 2.0, shown in Fig. 8.
Taking no account of uncertainty, the probabilities of intermediate nodes and top event can be calculated as follow:
When uncertainty exists, uncertain information will propagate from bottom events to top event through intermediate nodes [19]. Inputs of bottom events will be converted into interval values containing uncertainty, and the probabilities of intermediate nodes and top event will be determined by belief and plausibility functions. For top event, we can get:
Fig. 8BN model of an engine
4.3. Uncertain data processing
By referring to related documents, failure rates of , , , and at a given time are obtained as follows: 0.080, 0.080, 0.025, 0.050, 0.008-0.016. Because of lacking failure rates of and , so we consult two experts with rich experience in their domain respectively to determine the relationships between bottom events and intermediate events, shown in Table 2. According to the causal relationships between bottom events and intermediate events, there are only three logical links, i.e., (Failure of bottom event leads to failure of intermediate event.), (Failure of intermediate event is not relevant to failure of bottom event.), (The relationship between failure of bottom event and failure of intermediate event is uncertain.). And these three links make up the frame of discernment
Because we cannot use information from experts directly, so D-S evidence theory should be applied to fuse experts’ suggestions. Fuse data from Expert 1 and 2 according to Eqs. (8) and (9), we obtain:
Similarly, from Expert 3 and 4, we obtain:
Table 2Collection of expert suggestions
Expert 1 | 0.90 | 0.02 | 0.08 |
Expert 2 | 0.85 | 0.05 | 0.10 |
Expert 3 | 0.88 | 0.02 | 0.10 |
Expert 4 | 0.92 | 0.01 | 0.07 |
4.4. Reliability assessment of the engine
In BN model, inputs of node , , and are deterministic values, and the inputs of other three nodes are mean values of belief and plausibility functions. By inferring to Eqs. (16) and Eqs. (17)-(22) respectively, we obtain the same result: .
When uncertainty of root nodes is taken into consideration, probabilities of belief and plausibility functions of intermediate nodes and leaf node are calculated according to Eqs. (5) and (6), shown in Table 3. Because the failure rate of engine with deterministic inputs is 0.03717, while , we can make a conclusion that Bayesian network model is correct.
Table 3Probability values of intermediate nodes and leaf node
Node | ( 0) (×10-2) | ( 0) (×10-2) |
1.3852 | 2.2298 | |
0.1440 | 0.1630 | |
1.0678 | 2.5742 | |
0.6400 | 0.6400 | |
5.7600 | 6.5200 | |
2.5602 | 4.8656 |
According to Eqs. (11)-(14), importance indexes including probability importance, structural importance and criticality importance of root nodes are obtained, shown in Table 4 and Fig. 9. In order to make a comparison, we assure:
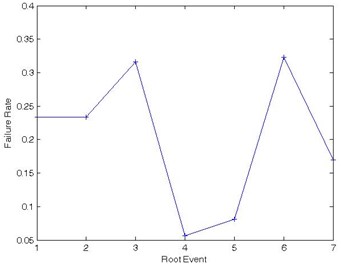
So the epistemic importance is calculated as follow according to Eqs. (15). From Table 4, we can see that probability importance and structural importance of , , are very high, because they are in OR nodes in BN model. That is to say, their reliability values affect that of the whole system directly. As to criticality importance values, except for these three events, and are included. Although uncertainties of , and are relatively lower, their epistemic importance are high than the other four events. Also, we can make a conclusion that the uncertainty is not related closely to the epistemic importance, so the uncertainty of an event cannot reflect its influence on the whole system. Assuming the engine is in failure, we can obtain the conditional probabilities of root events by backward reasoning with BN, shown in Fig. 9. Obviously, failure rate of event 3 and 6 are higher than the other events reaching 0.3167 and 0.3228 respectively. So and are weak nodes, and in reliability design and distribution, we should take them into consideration firstly. Of course, , and are important too, their reliability indexes also need our attention.
Table 4Results of importance analysis
Event | Uncertainty | (×10-2) | |||
0.0200 | 0.0775 | 0.0469 | 0.1668 | 0.1550 | |
0.0200 | 0.0775 | 0.0469 | 0.1668 | 0.1550 | |
0.0085 | 0.9743 | 0.1406 | 0.3080 | 0.8281 | |
0.0100 | 0.0482 | 0.0469 | 0.0324 | 0.0482 | |
0.0200 | 0.0241 | 0.0469 | 0.0324 | 0.0482 | |
0.0080 | 0.9745 | 0.1406 | 0.3146 | 0.7796 | |
0.0072 | 0.9689 | 0.1406 | 0.1642 | 0.6976 |
Fig. 9Importance analysis results
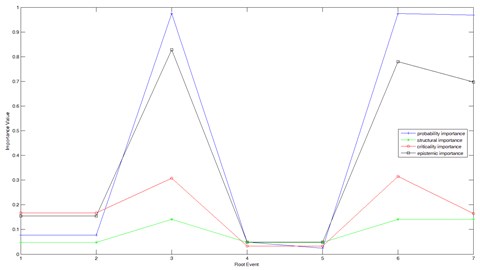
Fig. 10Failure rates of root events when system in failure
5. Conclusions
As a traditional reliability analysis method, fault tree analysis costs a lot of time and is easy to cause human errors when determining minimal cut sets or minimal path sets. Instead, Bayesian network has an advantage in establishing reliability analysis model precisely and clearly. With the using of special software such as MSBNX, BNT, Netica, BayesiaLab, GeNIe (applied in this paper), we can obtain the reliability values of the system and related nodes, and calculate the importance indexes of corresponding nodes. When uncertain data is taken into consideration, we should modify our model to deal with interval values or fuzzy values. At this moment, D-S evidence theory is good choice, especially when uncertain data has different sources, such as from different experts’ experiences. It provides a powerful tool to tackle uncertain information in data fusion, and express uncertain relationships between units and system when introduced into Bayesian network. Of course, D-S evidence theory may have the problem of conflict coefficient friction between the evidence in data fusion which need to improve in further work. Corresponding measures should be taken according to reliability assessment results to improve the reliability of the whole system, such as distributing a high reliability value to weak nodes in design, checking and testing performance parameters of weak nodes at a constant interval, maintaining a favorable storage environment.
References
-
Rania H., William C. Spacecraft reliability-based design optimization under uncertainty including discrete variables. Journal of Spacecraft and Rockets, Vol. 45, Issue 2, 2008, p. 394-405.
-
Mangey R., Singh S. B. Analysis of a complex system with common cause failure and two types of repair facilities with different distributions in failure. International Journal of Reliability and Safety, Vol. 4, Issue 4, 2010, p. 381-392.
-
Aven T., Nokland T. E. On the use of uncertainty importance measures in reliability and risk analysis. Reliability Engineering and System Safety, Vol. 95, 2010, p. 127-133.
-
Aven T. Interpretations of alternative uncertainty representations in a reliability and risk analysis context. Reliability Engineering and System Safety, Vol. 96, 2011, p. 353-360.
-
Yao W., Chen X. Q., Huang Y. Y., Michel V. T. An enhanced unified uncertainty analysis approach based on first order reliability method with single-level optimization. Reliability Engineering and System Safety, Vol. 116, 2013, p. 28-37.
-
Zhao Y., Fan F., Wang Jie, Xie K. G. Uncertainty analysis for bulk power systems reliability evaluation using Taylor series and nonparametric probability density estimation. Electrical Power and Energy Systems, Vol. 64, 2015, p. 804-814.
-
Alyson G. W., Christine M. A. C., Aparna V. H. A case study for quantifying system reliability and uncertainty. Reliability Engineering and System Safety, Vol. 96, 2011, p. 1076-1084.
-
Sankaran M., Zhang R. X., Natasha S. Bayesian networks for system reliability reassessment. Structural Safety, Vol. 23, 2001, p. 231-251.
-
Helge L., Luigi P. Bayesian networks in reliability. Reliability Engineering and System Safety, Vol. 92, 2007, p. 92-108.
-
Simona C., Weber P., Evsukoff A. Bayesian networks inference algorithm to implement Dempster Shafer theory in reliability analysis. Reliability Engineering and System Safety, Vol. 93, 2008, p. 950-963.
-
Zhao S. Q., Cheng D. C., Liu L. Reliability evaluation of power distribution system based on D-S evidence inference and Bayesian networks method. Transaction of China Electrotechnical Society, Vol. 24, Issue 7, 2009, p. 134-138.
-
Suo B., Zeng C., Cheng Y. S., Li J. Reliability analysis based on evidence theory and Bayesian network method. Systems Engineering and Electronics, Vol. 33, Issue 10, 2011, p. 2343-2347.
-
Gert De C. On modeling possibilistic uncertainty in two-state reliability theory. Fuzzy Sets and Systems, Vol. 83, 1996, p. 215-238.
-
Alyson G. W., Aparna V. H. Bayesian networks for multilevel system reliability. Reliability Engineering and System Safety, Vol. 92, 2007, p. 1413-1420.
-
Li Z. Q., Gu Dong J. Y. Q., Xu T. X. Assessment of complex system reliability based on FTA-BN method. Proceeding of 23th International Conference on Mechatronics and Machine Vision in Practice, 2016.
-
Niloofar P., Ganjali M., Rohani M. R. F. Improving the performance of Bayesian networks in non-ignorable missing data imputation. Kuwait Journal of Science, Vol. 40, Issue 2, 2013, p. 83-101.
-
Khalaj M., Makui A., Tavakkoli Moghaddam R. Risk-based reliability assessment under epistemic uncertainty. Journal of Loss Prevention in the Process Industries, Vol. 25, 2012, p. 571-581.
-
Guan X., Sun G. D., Guo Q., He Y. Radar emitter parameter recognition based on interval number and evidence theory. Systems Engineering and Electronics, Vol. 36, Issue 7, 2014, p. 1269-1274.
-
Claudio M. R. S., José E. R. M. Uncertainty propagation and sensitivity analysis in system reliability assessment via unscented transformation. Reliability Engineering and System Safety, Vol. 132, 2014, p. 176-185.
About this article

This work is supported by National Natural Science Foundation of China (No. 51605487).
