Abstract
Long-span suspension bridge increases rapidly in size as a result of bridge construction in a mountainous region, in addition, more and more long-span suspension bridges are in process of preparation. The bridge stiffness decreases with the increase of bridge span length, and hence the buffeting performance of bridge is sensitive to external factors. In this paper, the Cuntan Yangze Bridge located in a mountainous region is taken as the background to study the effect of different power spectrums on the buffeting performance. A three-dimensional finite element model is set up on the ANSYS platform. The fitted power spectrum of extreme strong wind is recorded and taken as the sample to analyze the buffeting performance. The results are compared with the specified power spectrum in the time and frequency domains. Different from existing studies, buffeting performances with the fitted power spectrum are larger than those with the specified power spectrum on the whole. Two kinds of power spectrum are coincidental in the overall tendency in the frequency domain and are distinct in the low frequency region. Structure performance of long-span suspension bridge in the mountainous region should be the subject of specially paid attention.
1. Introduction
Long-span bridges have been built throughout the whole country of China with the rapid development of the economy and technology. At the design stage of long-span bridges, suspension bridges are always taken as the priority selection from all the types of bridges because of a large span capacity. The bridge stiffness decreases with the increase of bridge span length, and hence the long-span bridge is sensitive to wind-induced vibration. Wind-induced vibration is a key of long-span bridge considered by designers and bridge safety regulators. To successfully manage the bridge, buffeting suppression is the objective of aerodynamic control [1].
1.1. Suspension bridge and wind characteristic in a mountainous region
With the socioeconomic development of the Western China taken up mainly by large mountainous areas, there is a great need for good transport. Therefore, the long-span suspension bridge increases rapidly in size as a result of the bridge construction in the mountainous region, in addition, more and more long-span suspension bridges are in process of preparation. Affected by the topography, wind characteristics in the mountainous region are different from the standard wind characteristics. The influence of the topography on the wind field and the associated effects on the displacement response are remarkable [2, 3]. In order to get the buffeting performance closer to the realistic environment, the wind speed and related wind characteristic parameters of the bridge are derived from the wind measure system at the bridge site.
1.2. Buffeting performance of bridge
Buffeting performance of bridge is a forced vibration caused by wind turbulence. Fatigue damage of bridge components and discomfort for vehicles and pedestrians can be interfered with the buffeting performance.
Buffeting control work of a long-span bridge has always been a hot discussion researched by many scholars. Buffeting-induced mechanisms are the foundation of buffeting control, such as structural parameters [3], hanger oscillation of suspension bridge [4], non-stationary characteristics induced by typhoon [5]. The buffeting suppression method includes active and passive buffeting control [6-8]. Optimal buffeting control of multiple tuned mass dampers [9-12] and mechanically driven flaps [13-15] has been a hot area of research for recent years.
As to long-span bridge engineering, researchers have been working to effectively improve the calculating precision on the basis of classical theories and meet the engineering requirements. The improvements may be concluded in three aspects, the bridge with more details considered, and the outer environment more agree to the real condition and more reasonable analysis theories. Influences of buffeting performance with more bridge details were given including mid-tower, continuous span, catwalk, slotted deck and central buckle [16-19]. Outer environment conditions more correspond to the reality and considered such astopography, extreme value of typhoon, turbulent spatial correlation coefficient, skew wind, design and measured power spectrum, non-stationary and stochastic excitation [2, 5, 18-25]. Improved analysis theories were applied in the buffeting performance including linear and non-linear regression analysis, evolutionary power spectral density, varying frequency-increment sweeping method, three-dimensional simulation [19, 21, 24, 26-30].
In conclusion, the buffeting performance with consideration of wind characteristics can reflect the response of bridge closer to the real condition. However, most of previous researches were concentrated in sea-crossing and river-crossing bridges in design or specified power spectrum of turbulent wind. The buffeting performance of long-span bridges based on the measured wind data is still insufficient. The long-span suspension bridge is about to appear in large numbers in the mountainous region, and hence its buffeting performance in extreme strong wind can provide references for other bridges in a similar region.
In this paper, the long-span suspension bridge and wind measure system were introduced. The real-time wind data recorded from wind measure system was recorded and analyzed. A three-dimensional finite element model was set up on the ANSYS platform. The extreme strong wind record in a wind database was taken as a sample to analyze the buffeting performance of long-span suspension bridge, and the results were compared with the specified power spectrum in the time and frequency domains.
2. Long-span suspension bridge and measured wind speed data
2.1. Project overview
Cuntan Yangtze Bridge including main section and approach bridge locates in Chongqing, China. It’s a streamlined box-girder suspension bridge with twin towers. Span arrangement is 250.0 m+880.0 m+250.0 m. The main girder of the Cuntan Yangtze Bridge is a streamlined closed, flat box girder. The total width of the girder is 42.0 m, and the height at the centerline is 3.5 m. Rise-to-span ratio in this bridge is 1/8.8, and the distance of two main cables is 39.2 m. The bridge elevation is shown in Fig. 1(a), and the design sketch after construction is shown in Fig. 1(b). The north tower is 194.5 m, and the south tower is 199.5 m in height. The main cable is made up of 127 high-strength galvanized steel wires.
Fig. 1Cuntan Yangtze bridge’s configuration
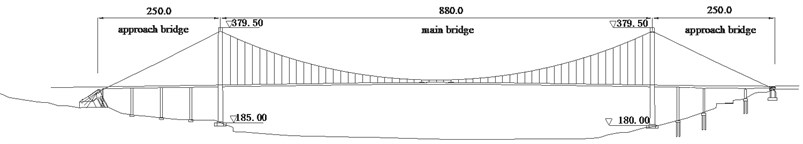
a) Elevation (m)
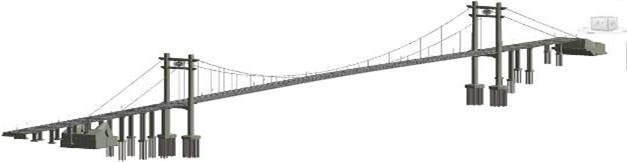
b) Design sketch
2.2. Wind measure system
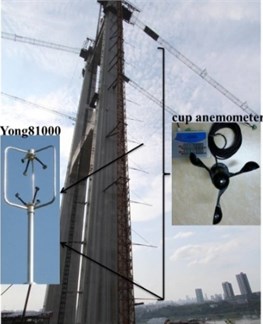
The topography influence on the wind field and the associated effects on the wind-induced vibration are outstanding [31, 32]. The Cuntan Yangtze Bridge has two main towers, and the wind measure system is installed on the south main tower. The wind measure system is a ten-storied system with two kinds of wind speed measuring instruments. There is a ten-meter distance between two observation layers in vertical. In order to obtain the turbulent wind properties at the mountainous bridge site, two Yong81000 ultrasonic anemometers are used to collect wind data. Ten cup anemometers are installed in the wind measurement system to get the mean wind properties at the mountainous bridge site. The arrangement of wind measurement system is shown in Fig. 2.
Fig. 2Arrangement of wind measure system.
2.3. Extreme wind record
The wind measurement system collected wind data from 1st May 2014 to 30th April 2016, the collected wind data was partitioned by 10 minutes, and the invalid data points were deleted. The wind data participated in analysis with an effective rate above 90 %. To ensure the integrity and consistency of the subsample, the position of deleted invalid data was filled by the interpolation method. Twenty-five times strong wind with a speed of above 10.0 m/s was recorded during the observation period. The largest recorded wind speed was on 2:25-2:35, 26th August 2014, and the wind data was given in Fig. 3.
Fig. 3Wind speed at 10 m height on 2:25-2:35, 26th August, 2014
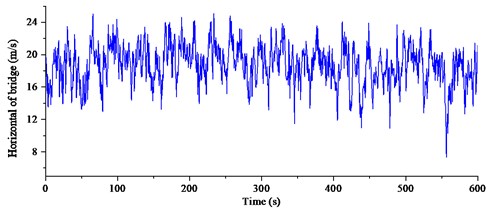
a) Horizontal of bridge
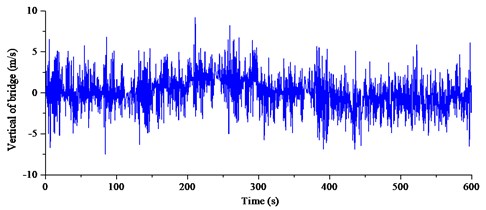
b) Vertical of bridge
3. Numerical analysis model of buffeting performance
3.1. Modal of bridge
A three-dimensional finite element model was set up on the ANSYS platform. Spatial beam4 element was used to simulate the main girder, and the beam44 element was used to simulate main towers. Link10 element with three degrees of freedom was used to simulate main cables and suspenders. Pavement and railings’ stiffness contributions were neglected, and their lumped masses were equally distributed to the main girder with mass21 element. Combin14 element was selected to simulate damper. The numerical simulation of the Cuntan suspension bridge was constructed according to the data shown in 2.1 part of this paper. According to the design, material properties and elements’ characteristics were added in the model and given in Table 1.
Table 1Type of material
Material number | Modulus of elasticity (Pa) | Poisson’s ratio | Density (N/m3) | Material | Application |
1 | 2.10E+11 | 0.3 | 7850 | Q345QD | Main girder |
2 | 2.00E+11 | 0.3 | 8650 | High-strength steel wire | Main cable, suspension cable |
3 | 3.45E+10 | 0.2 | 2650 | C50 RC | Main tower |
4 | 1.00E+15 | 0 | 0 | Rigid transverse beam |
Ernst equation of equivalent modulus of elasticity was used to calculate linearized stiffness of back cables’ nonlinearity stiffness. According to the bridge design, the deck and main towers were coupled in three degrees of freedom, including the vertical displacement, transverse displacement, and rotation around longitudinal direction. Two main cables were fixed on the top of towers, and the bottoms of main cables were fixed at the bases. Two main towers were also fixed at the bases without considering the soil-pile structure interaction. The bridge was dispersed into 818 elements and 721 nodes. Fig. 4 gave the three-dimensional finite element model of the Cuntan Yangtze Bridge.
Fig. 4Finite element model of Cuntan Yangtze bridge
3.2. Specified power spectrum of turbulent wind
To bridge engineering, it is of great significance to investigate the wind properties acting on the long-span bridge. An accurate power spectrum mode of turbulent wind can give the exact response of long-span bridge. During the past research about power spectrum of turbulent wind, it is found that the Karman power spectrum in the along-wind direction and Panofsky power spectrum in the vertical-wind direction are normalized power spectrums [33]. Two power spectrums are given in Eq. (1), Eq. (2) and Eq. (3):
For the Karman power spectrum in the along-wind direction:
For the Panofsky power spectrum in the vertical-wind direction:
where is the auto-power spectral density of along-wind turbulence, and is the auto-power spectral density of vertical turbulence. is the wind speed frequency; is the height of the wind speed. is the mean wind speed at 10 m height. is the Moning coordinate. and are the wind friction speeds.
3.3. Measured power spectrum of turbulent wind
The Hamming window and piecewise smoothing method were used to analyze the wind speed data in order to get the power spectrum of turbulent wind. The Hamming window was adopted to reduce the signal leakage in the frequency domain. The piecewise smoothing method was used to reduce the random error of spectrum estimates.
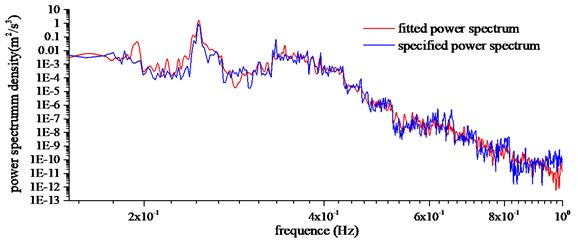
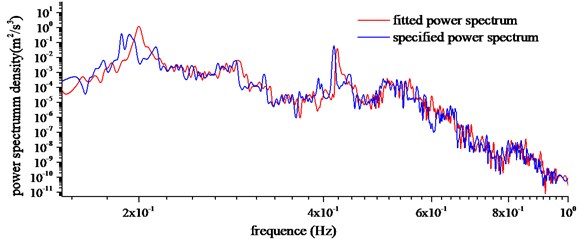
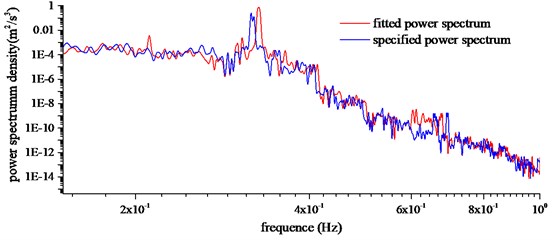
Measured power spectrums in the vertical-wind direction and along-wind direction were given in Fig. 5. It was found that the measured power spectrum lines did not match well with the Karman and Panofsky power spectrums. The relatively apparent deviations can be witnessed both in the along-wind and vertical-wind directions. Measured power spectrum line in the along-wind direction was a bit lower than the Karman power spectrum in a lower frequency and on the contrary in a higher frequency. Measured power spectrum in the vertical-wind direction was a bit higher than the Panofsky power spectrum in a lower frequency and on the contrary in a higher frequency. The relatively apparent deviations can be witnessed in the along-wind and vertical-wind directions.
It was witnessed that measured power spectrums had an apparent deviation with the specified ones. Therefore, fitted power spectrums were put forward to analyze the buffeting performance of suspension bridge. The Karman power spectrum and Panofsky power spectrum were used as the fundamental formulae. The fitted formulae can be expressed in Eq. (4) and Eq. (5):
where , , and are the fitting parameters and calculated by the anonymous function in MATLAB. Value of , , and are 30.21, 5.32, 28.16, 6.56 respectively.
Fig. 5Comparison of measured and specified power spectrum
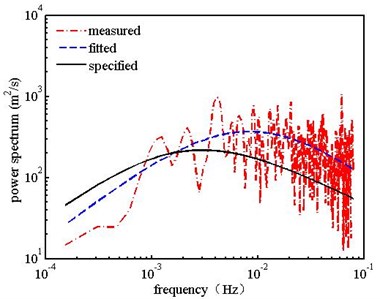
a) Along-wind direction
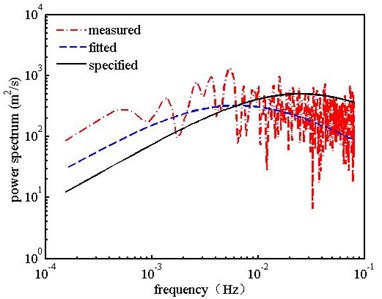
b) Vertical-wind direction
4. Calculation preparation of buffeting performance
4.1. Dynamic characteristic analysis
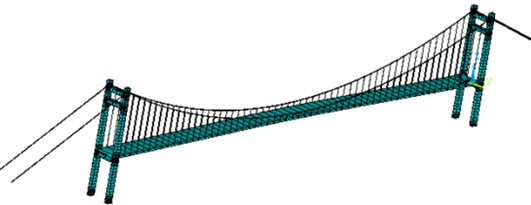
Analyses were performed using modal approach, solving the bridge dynamics equations of equilibrium in generalized coordinates through a state space transformation based on the first twenty modes. The vibration mode of the Cuntan Yangtze Bridge was shown in Fig. 6. The first twenty natural frequencies were listed in Table 2.
Fig. 6Vibration mode of Cuntan Yangtze bridge
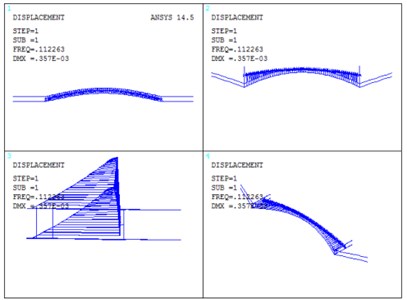
a) First order vibration mode
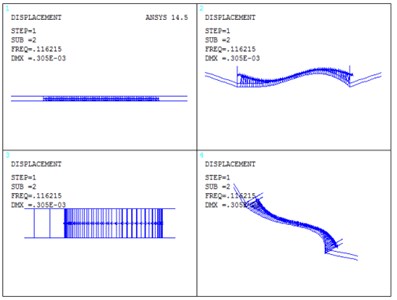
b) Second order vibration mode
From Fig. 6 and Table 2, it can be summarized that: The fundamental frequency is 0.1122 Hz, corresponding to the symmetric lateral vibration of girder, and the basic period of structure is short. The second frequency is 0.1162 Hz, corresponding to anti-symmetric vertical vibration of the main girder. This vibration mode of second frequency conforms to the basic rule of the dynamic performance of the flexible structure. In the first twenty-order vibration mode, vibrations of main cable and girder are taken as the principal vibration modes, without appearing vibrations of main tower. It is probably due to that stiffness of main tower is considerably larger than stiffness of main cable and girder. The distribution range of first twenty-modal frequency is 0.1122 Hz-0.4702 Hz, and distribution of overall frequency is relatively wide.
Table 2Frequencies of Cuntan Yangtze bridge
Order | Frequency (Hz) | Mode shape |
1 | 0.1122 | The 1st symmetric lateral vibration of the main girder |
2 | 0.1162 | The 1st anti-symmetric vertical vibration of the main girder |
3 | 0.1735 | The 2nd symmetric vertical vibration of the main girder |
4 | 0.2495 | The 3rd symmetric vertical vibration of the main girder |
5 | 0.2689 | The 1st symmetric lateral vibration of the main cable |
6 | 0.2698 | The 2nd anti-symmetric lateral vibration of the main girder |
7 | 0.2719 | The 4th anti-symmetric vertical vibration of the main girder |
10 | 0.3107 | The 2nd anti-symmetric lateral vibration of the main cable |
15 | 0.3914 | The 1st anti-symmetric torsional vibration of the main girder |
20 | 0.4702 | The 3rd anti-symmetric lateral vibration of the main cable |
4.2. Measurement of aerostatic force coefficients
The aeroelastic effects on the bridge deck were measured by aerostatic force experimental coefficients. Fig. 7 showed the experimental aerostatic force in the wind tunnel test. The bridge section model was made of wood. Pedestrian guardrails, anti-collision guardrails and center separation band guardrails were manufactured in plastic plates by machine. The section model was 2.1 m in length, 0.7 m in width, and 0.0583 m in height with a scalar of 1/60 to the real bridge. It was fixed by eight springs on supports, providing a vibration system with two degrees of freedom which can simulate vertical and torsional vibration. The distance of springs was 108.0 cm. Two laser displacement sensors placed under the section model were used in testing the displacement of bridge. The distance between laser displacement sensors was 40.0 cm.
Fig. 7Test of aerostatic force coefficients
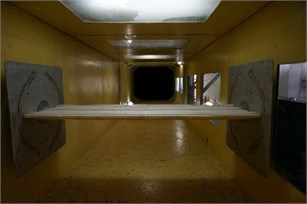
a) 0° wind attack angle
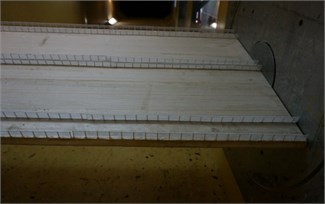
b) +12° wind attack angle
Wind tunnel test requires that the section model is similar to the real bridge in geometric dimensions, as well as frequency and damping ratio. But actually, the section model of bridge cannot have similarity with a prototype model in all aspects. Deviation is allowable in the wind tunnel test. Allowable damping ratio deviation should be controlled in less than 10.0 %. From Table 3, it can be calculated that the deviation is 4.30 % on vertical bending damping ratio and 3.80 % on torsion damping ratio, and other parameters keep the same as the prototype modal. As a consequence, the results of experiment are effective.
The results of aerostatic force coefficients at different wind attack angles were shown in Fig. 8.
Table 3Design parameters of section mode
Parameter | Unit | Actual value | Required value | Value in test |
Height | m | 3.50 | 0.0583 | 0.0583 |
Width | m | 42.00 | 0.70 | 0.70 |
Linear mass | kg/m | 27600 | 7.667 | 7.667 |
Linear mass moment of inertia | kg∙m2/m | 5137700 | 0.3987 | 0.3987 |
Vertical bending frequency | Hz | 0.174 | 2.216 | 2.216 |
Vertical bending damping ratio | % | 0.50 | 0.389 | 0.372 |
Torsion frequency | Hz | 0.391 | 5.404 | 5.404 |
Torsion damping ratio | % | 0.50 | 0.439 | 0.422 |
Parameter | Unit | Actual value | Required value | Value in test |
Height | m | 3.50 | 0.0583 | 0.0583 |
Fig. 8Aerostatic force coefficients and its derivatives. CL, CD and CM are dimensionless lift, drag and moment coefficients, CL', CD' and CM' are derivatives of lift, drag and moment coefficients
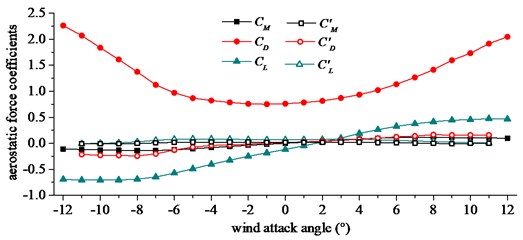
Aerostatic force coefficients and their derivatives of , and were used to calculate the buffeting loads. Buffeting loads at per-unit span length are expressed in Eq. (6), Eq. (7) and Eq. (8):
where , and represent lift, drag and moment from buffeting effects, respectively. , and are dimensionless lift, drag and moment coefficients at a specified wind attack angle, and wind attack angle is taken as 0° in this buffeting performance analysis. and are wind velocity fluctuations in the horizontal and vertical directions, respectively. , and are aerodynamic admittances.
4.3. Calculation of buffeting force
Wind loads acting on the bridge deck can be divided into two parts, including self-excited aerodynamic loads and turbulent loads. Buffeting loads can be expressed in Eq. (9), Eq. (10) and Eq. (11) [25, 33-37]:
where , and represent lift, drag and moment from self-excited motions, respectively. Self-excited and buffeting forces are shown schematically in Fig. 9.
Fig. 9Aerodynamic forces on bridge deck
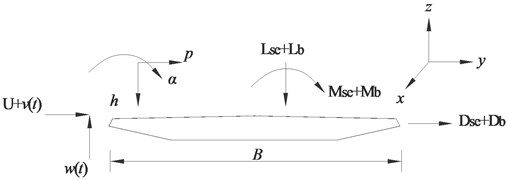
The lift, drag and moment of the self-excited part of the force at the per-unit length of the deck can be expressed in Eq. (12), Eq. (13) and Eq. (14):
where represents air density. represents the bridge deck width. represents the reduced frequency, and , represents the circular frequency of the bridge motion. , , ( 1, 2, 3, 4, 5, 6) represent flutter derivatives of the bridge deck measured through the wind tunnel tests in the Southwest Jiaotong University. The identified flutter derivatives were inputted as the coefficients in the aeroelastic stiffness and damping matrices of Matrix27. represent the mean wind velocity. , and represent vertical, horizontal and rotational displacements of the bridge deck, respectively.
The buffeting forces were applied to the finest element model by APDL programming. The buffeting forces acting on the main towers were neglected.
5. Results and analyses of buffeting performance
5.1. Buffeting performance in time domain and root mean square (RMS) responses
Based on the wind database, the mean wind speed value of the whole analysis period was taken as 19.3 m/s and the analysis period was 600 s. The buffeting responses of the Cuntan Yangze Bridge were calculated using the Kaimal power spectrum in the along-wind direction, the Panofsky power spectrum in the vertical-wind direction (which was named as specified power spectrum) and the fitted power spectrums. The buffeting responses of the bridge deck were critical in evaluating comfort during buffeting, determining the dynamic wind loads, and calculating the fatigue reliability of steel box girders. The girder of midspan was constrained at least by comparing with other sections of girder. Therefore, buffeting responses at the girder midspan were taken as a typical section of girder. Buffeting responses with different power spectrum were shown in Fig. 11-Fig. 13.
Comparisons of RMS buffeting displacements at the midspan and 1/4 span of girder were given in Table 4. From the deviation in Table 4, the average deviation in three directions was 16.67 % at the midspan and 10.67 %, 10.22 % at 1/4 span. Therefore, it can be summarized that RMS buffeting displacements at the midspan were affected more apparently than 1/4 span in three directions. Deviations in vertical and transverse direction were 3.53 % and 3.20 %, 2.03 % and 2.44 % at 1/4 span. Effects of power spectrum in the vertical and transverse directions were almost the same at 1/4 span. Deviations in the vertical and transverse directions were 11.16 % and 5.26 % at midspan. The deviation in the vertical direction was more than double in the transverse direction at midspan. Deviations in the torsional direction respectively were 33.57 %, 25.25 % and 26.20 %. Effects of power spectrum on torsional direction were most obvious in three directions.
Fig. 11Vertical buffeting responses with different power spectrums
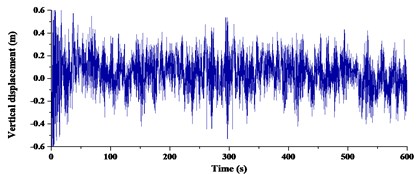
a) Specified power spectrum
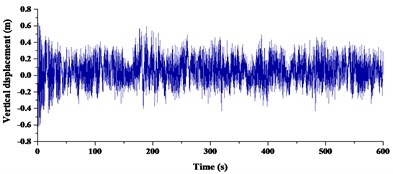
b) Fitted power spectrums
Fig. 12Horizontal buffeting responses with different power spectrums
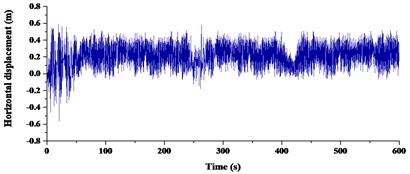
a) Specified power spectrum
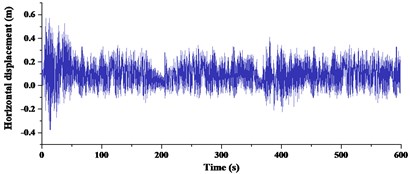
b) Fitted power spectrums
Fig. 13Torsional buffeting responses with different power spectrums
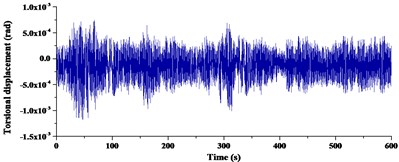
a) Specified power spectrum
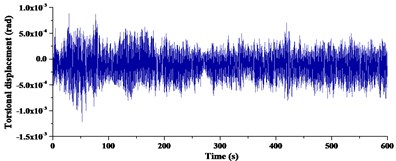
b) Fitted power spectrums
Table 4Comparison of RMS buffeting displacements
a) At midspan girder: 435 m along the distance | |||
Spectrum | Vertical (m) | Transverse (m) | Torsional (°) |
Specified | 0.224 | 0.171 | 4.26×10⁻⁴ |
Fitted | 0.249 | 0.180 | 5.69×10⁻⁴ |
Deviation (%) | 11.16 | 5.26 | 33.57 |
b) At 1/4 girder: 215 m along the distance | |||
Spectrum | Vertical (m) | Transverse (m) | Torsional (°) |
Specified | 0.255 | 0.125 | 2.321×10⁻⁴ |
Fitted | 0.264 | 0.129 | 2.907×10⁻⁴ |
Deviation (%) | 3.53 | 3.20 | 25.25 |
c) At 1/4 girder: 655 m along the distance | |||
Spectrum | Vertical (m) | Transverse (m) | Torsional (°) |
Specified | 0.246 | 0.123 | 2.351 |
Fitted | 0.251 | 0.126 | 2.967 |
Deviation (%) | 2.03 | 2.44 | 26.20 |
In order to summarize the effect of power spectrum on the main girder, RMS responses at critical parts were displayed in Fig. 14.
From RMS responses in Fig. 14, the following conclusions can be summarized: RMS in three directions showed a symmetrically tendency on the whole centering on the midspan. In transverse and torsional direction, the RMS responses increased moderately from endspan to midspan. In vertical direction, the RMS responses varied slowly from 1/4 span to midspan but increased at a quick speed from endspan to 1/4 span. The max RMS responses in transverse and torsional direction both appeared in the midspan, while max RMS responses in vertical direction appeared in at 1/4 span. Both of fitted and specified power spectrum RMS responses showed the same tendency in three directions, evidencing that numerical modeling accuracy of the suspension bridge was credible. RMS responses with fitted power spectrum were obvious larger than the specified ones at midspan in three directions, and discrepancy in torsional direction was the largest.
Fig. 14RMS responses along bridge distance
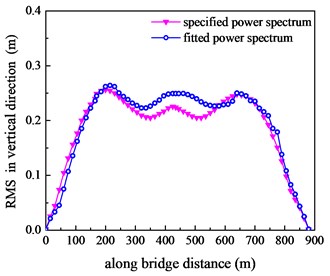
a) Vertical direction
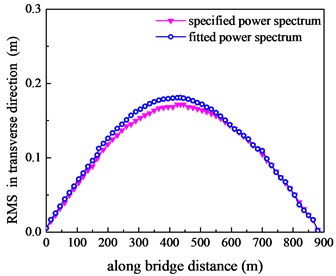
b) Transverse direction
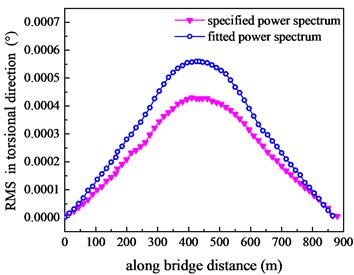
c) Torsional direction
5.2. Buffeting performance in frequency domain
The buffeting performance in the time domain changes from time to time. For analysis convenience, the buffeting performances in the time domain was chosen for the auto-power spectrum analysis by fast Fourier transform (FFT). The size of FFT was 1024, and a nonlinear least-squares fitting technique was used to reduce the random error of spectral estimates. In order to find out the contribution of vibration mode to buffeting responses, vertical, horizontal and torsional direction responses were transformed in the frequency domain. Power spectrum density with specified power spectrum and fitted power spectrum of midspan were given in Fig. 15, including vertical, horizontal and torsional directions.
The following conclusions can be summarized from Fig. 15: Specified power spectrum and fitted power spectrum were coincidental in the tendency and location of peak points. For a frequency range higher than 0.40 Hz, the agreement was positive owing to that the deviation of wind power spectrum was exceedingly small. The specified power spectrum was consistent with fitted power spectrum better in the high frequency region, and there was a distinct discrepancy in the low frequency region. The energy of wind was concentrated within the range of 0.02 Hz-1.0 Hz, and the energy contribution of low frequency was more significant. The first peak point corresponded to the forth mode in the vertical direction, and that was the third symmetric vertical vibration of the main girder. The first peak point corresponded to the sixth mode in the transverse direction, and that was the second anti-symmetric lateral vibration of the main girder. The first peak point corresponded to the fourteenth mode in the torsional direction, and that was the first symmetric torsional bending mode. This implied that the contribution of the first mode was not always the largest.
Fig. 15Buffeting displacement power spectrum of midspan
a) Vertical direction
b) Transverse direction
c) Torsional direction
6. Conclusions
A comprehensive research was carried out to study the buffeting performance of long-span suspension bridge in a mountainous region. The buffeting responses at different critical sections were displayed. The effects of wind power spectrum on buffeting responses were analyzed via displacement and power spectrum. Contribution of frequency on buffeting responses was revealed via the power spectrum. Conclusions can be summarized as follows:
1) Fitted power spectrum in extremely strong wind has a significant difference from the specified power spectrum, and has great effects on the buffeting performance. As to this long-span suspension bridge, the basic frequency is high, and the overall mode frequency has a relative wide distribution.
2) The RMS responses with the fitted power spectrum overcome the responses with the specified power spectrum, and this phenomenon is outstanding in the torsional direction. Nonetheless, previous studies have shown the responses with the fitted power spectrum overcome the responses with the specified power spectrum in most of regions. Therefore, a particular attention should be paid to the buffeting performance of long-span bridges in the mountainous region.
3) As to the overall tendency and location of peak points, the buffeting performances in the frequency domain are coincidental. However, two kinds of power spectrum are consistent better in the high frequency region, and there is a distinct discrepancy in the low frequency region. For this bridge, the first mode contribution is not always the largest.
References
-
Limebeer D. J. N., Graham J. M. R., Zhao X. Buffet suppression in long-span suspension bridges. Annual Reviews in Control, Vol. 35, 2011, p. 235-246.
-
Etienne C., Jasna B. J., Jónas S. Buffeting response of a suspension bridge in complex terrain. Engineering Structures, Vol. 128, 2016, p. 474-487.
-
Wang H., Chen C. C., Xing C. X., et al. Influence of structural parameters on dynamic characteristics and wind-induced buffeting responses of a super-long-span cable-stayed bridge. Earthquake Engineering and Engineering Vibration, Vol. 13, Issue 3, 2014, p. 389-399.
-
Zhang Z. T., Wu X. B., Chen Z. Q. Mechanism of hanger oscillation at suspension bridges: buffeting-induced resonance. Journal of Bridge Engineering, Vol. 21, Issue 3, 2016, p. 4015066.
-
Hu L., Y. L., Huang, W. F. Typhoon-induced non-stationary buffeting response of long-span bridges in complex terrain. Engineering Structures, Vol. 57, 2013, p. 406-415.
-
Sun Jie, Li M. Effects of motion-induced aerodynamic force on the performance of active buffeting control. Journal of Vibroengineering, Vol. 18, Issue 2, 2016, p. 951-964.
-
Geng F. F., Ding Y. L., Li A. Q. Passive control system for mitigation of longitudinal buffeting responses of a six-tower cable-stayed bridge. Mathematical Problems in Engineering, 2016, https://doi.org/10.1155/2016/6497851
-
Domaneschi M., Martinelli L. Refined optimal passive control of buffeting-induced wind loading of a suspension bridge. Wind and Structures, Vol. 18, Issue 1, 2014, p. 1-20.
-
Wang H., Tao T. Y., Cheng H. Y., et al. A simulation study on the optimal control of buffeting displacement for the Sutong bridge with multiple tuned mass dampers. Journal of Zhejiang University: Science A, Vol. 15, Issue 10, 2014, p. 798-812.
-
Wen Y. K., Lu W. L. Parametric optimization and analysis of distributed TMD for buffeting response control of cable-stayed bridges. China Civil Engineering Journal, Vol. 47, Issue 6, 2014, p. 88-96.
-
Domaneschi M., Martinelli L., Po E. Control of wind buffeting vibrations in a suspension bridge by TMD: Hybridization and robustness issues. Computers and Structures, Vol. 155, 2015, p. 3-17.
-
Nariman N. A. Control efficiency optimization and Sobol’s sensitivity indices of MTMDs design parameters for buffeting and flutter vibrations in a cable stayed bridge. Frontiers of Structural and Civil Engineering, Vol. 11, Issue 1, 2017, p. 66-89.
-
Phan D. H., Kobayshi H. An experimental study of flutter and buffeting control of suspension bridge by mechanically driven flaps. Wind and Structures, Vol. 14, Issue 2, 2011, p. 153-165.
-
Phan D. H., Nguyen N. T. Flutter and buffeting control of long-span suspension bridge by passive flaps: Experiment and numerical simulation. International Journal of Aeronautical and Space Sciences, Vol. 14, Issue 1, 2013, p. 46-57.
-
Phan D. H., Kobayshi H. Analytical and experimental study on aerodynamic control of flutter and buffeting of bridge deck by using mechanically driven flaps. Structural Engineering and Mechanics, Vol. 46, Issue 4, 2013, p. 549-569.
-
Tao T. Y., Wang H., Li A. Q. Influence of mid-tower on buffeting performance of a long-span triple-tower suspension bridge with continuous span. Journal of Vibration, Measurement and Diagnosis, Vol. 36, Issue 1, 2016, p. 131-137.
-
Li Y. L., Wang D. X., Wu C. P. Aerostatic and buffeting response characteristics of catwalk in a long-span suspension bridge. Wind and Structures, Vol. 19, Issue 6, 2014, p. 665-686.
-
Zhou Q., Zhu L. D., Zhao C. L. Numerical analysis on stochastic buffeting of cable-stayed bridge with slotted deck. China Civil Engineering Journal, Vol. 47, Issue 8, 2014, p. 98-106.
-
Wang H., Li A. Q., Zhao G. W., et al. Non-linear buffeting response analysis of long-span suspension bridges with central buckle. Earthquake Engineering and Engineering Vibration, Vol. 9, Issue 2, 2010, p. 259-270.
-
Hu L., Xu Y. L. Extreme value of typhoon-induced non-stationary buffeting response of long-span bridges. Probabilistic Engineering Mechanics, Vol. 36, 2014, p. 19-27.
-
Tao T. Y., Wang H., He X. H., et al. Evolutionary power spectral density analysis on the wind-induced buffeting responses of Sutong Bridge during Typhoon Haikui. Advances in Structural Engineering, Vol. 20, Issue 2, 2017, p. 214-224.
-
Mao J. X., Wang H., Tao T. Y., et al. Effects of the turbulent spatial correlation coefficient on buffeting responses of a triple-tower suspension bridge. Journal of Vibration and Shock, Vol. 35, Issue 10, 2016, p. 202-206.
-
Huang M. H., Lin Y. Y., Weng M. X. Flutter and buffeting analysis of bridges subjected to skew wind. Journal of Applied Science and Engineering, Vol. 15, Issue 4, 2012, p. 401-413.
-
Guo Z. W., Ge Y. J., Zhao L., et al. Linear regression analysis of buffeting response under skew wind. Wind and Structures, Vol. 16, Issue 3, 2013, p. 279-300.
-
Wang H., Hu R. M., Xie J., et al. Comparative study on buffeting performance of Sutong bridge based on design and measured spectrum. Journal of Bridge Engineering, Vol. 18, Issue 7, 2013, p. 587-600.
-
Zhang Z. T., Xie X. H. Wind-induced stochastic buffeting responses of bridges based on a varying frequency-increment sweeping method. Engineering Mechanics, Vol. 31, Issue 8, 2014, p. 101-107.
-
Zhao X. W., Gouder K., Graham J., et al. Buffet loading, dynamic response and aerodynamic control of a suspension bridge in a turbulent wind. Journal of Fluids and Structures, Vol. 62, 2016, p. 384-412.
-
Kim B. C., Yhim S. S. Buffeting analysis of a cable-stayed bridge using three-dimensional computational fluid dynamics. Journal of Bridge Engineering, Vol. 19, Issue 11, 2014, p. 4014044.
-
Ibrahim K., Morgenthal G. Pseudo three-dimensional simulation of buffeting response under turbulent wind. Engineering for Progress on Nature and People, 2014, p. 309-316.
-
Wang H., Xu Z. D., Tao T. Y., et al. Field measurement study on the EPSD of non-stationary buffeting response of Sutong bridge based on WT. Engineering Mechanics, Vol. 33, Issue 9, 2016, p. 164-170.
-
Hui M. C., Larsen A., Xiang H. F. Wind turbulence characteristics study at the stonecutters bridge site: part ii – wind power spectra, integral length scales and coherences. Journal of Wind Engineering and Industrial Aerodynamics, Vol. 97, 2009, p. 48-59.
-
Lee J. H., Huh J. W., Lee J. J. A comparative study on wind loads between design standards for the design of pipe-rack structures. KSCE Journal of Civil Engineering, Vol. 20, 2016, p. 293-300.
-
Wang H., Asce A. M., Li A. Q., et al. Comparison of ambient vibration response of the Runyang suspension bridge under skew winds with time-domain numerical predictions. Journal of Bridge Engineering, Vol. 16, 2011, p. 513-526.
-
Ma T. T., Ge Y. J. Uncertainty effects of structural FE model and turbulent wind loading on bridge buffeting response. Journal of Structural Engineering (India), Vol. 41, Issue 1, 2014, p. 1-10.
-
Seo D. W., Caracoglia L. Statistical buffeting response of flexible bridges influenced by errors in aeroelastic loading estimation. Journal of Wind Engineering and Industrial Aerodynamics, Vol. 104, Issue 106, 2012, p. 129-140.
-
Zasso A., Stoyanoff S., Diana G., et al. Validation analyses of integrated procedures for evaluation of stability, buffeting response and wind loads on the Messina bridge. Journal of Wind Engineering and Industrial Aerodynamics, Vol. 122, 2013, p. 50-59.
-
Debasis K., Samit R. C., Masanobu S. Conditional simulation of non-Gaussian wind velocity profiles: Application to buffeting response of Vincent Thomas suspension bridge. Probabilistic Engineering Mechanics, Vol. 29, 2012, p. 167-175.
About this article

This study is financially supported by the National Natural Science Foundation of China (51578098 and 51608074), Fundamental Research Funds for the Central University (106112017CDJXY200009), Graduate Scientific Research and Innovation Foundation of Chongqing (CYB17042).
