Abstract
In order to improve screening performance, a creative vibrating screen with a new mode coupling of translation and swing was proposed which inspired by the manner of manual sieving. A mechanical model of the new motion was established. The discrete element method (DEM) was used to study the particulate systems with the complex particle size distribution considering interactions between particles. This paper simulated the screening process with the new compound trace to calculate screening efficiency in different vibration parameters. Vibration parameters mainly encompass swing angle, swing frequency, translation frequency, translation direction angle, and amplitude. The functional relationships between screening efficiency and vibration parameters were presented based on 3D-DEM simulations. The results show that each vibration parameter has an optimum value in simulations. The relationships and optimal parameters offer insights to vibrating screen design, manufacture and installation. Compared to single translation or swing trace, screening efficiency were improved. The laboratory-scale vibrating screen with transformation parameters was created for validating the screening principle from the simulation data.
1. Introduction
Vibrating screen is one of the most commonly used screening equipment in industry. Higher efficiency and larger capacity of vibrating screen are key improvement goals. Vibrating screens are always classified by vibrating trace of screening plate. Generally, there are three kinds of vibrating screens including translation vibrating screen, circular vibrating screen and elliptical vibrating screen. These motions of screening plates which follow the same path everywhere make that the screen has constant transport velocity and throwing index. That leads to limited efficiency. Increasing the throwing index in the screening process to improve the processing capacity is deeply discussed [1, 2].
In recent years, DEM has been widely used in numerical simulation of vibrating screen [7-10]. Using DEM, Cleary separated 8000 spherical particles on a simplified inclined screen surface in 2002 [3]. In 2008, Jiao and Zhao developed SieveDEM programs to simulate three kinds of particle penetration behaviors in screening process [4]. In 2008, Liu and tong simulate sieving of three dimensional spherical particle considering particle-particle collisions with the method of DEM [5]. Screening process of banana screen were conducted with DEM by Dong and Cleary (2009) [6-8]. In 2015, li presented the non-parametric model of screening efficiency using the integration of DEM and SVM [9]. Using DEM, in 2016 Zhong simulated an elliptical vibrating screen process to provide good understanding about screening performance [10]. The screen plate was improved by simulation of screening process with DEM in 2017 [11]. DEM has been proved as an effective research technique.
In order to improved screening efficiency, different types of screen surface movement have been studied by some researchers. For translation vibrating screen, the screening parameters including vibration frequency, amplitude, and the vibration direction angle effect on single particle kinematics were studied in a simulation system [12]. The swing mode was researched by Xiao including calculating screening efficiency in different vibration parameters [13]. Further, the vibrating screen with variable elliptical trace was also discussed, which included the mechanical model and screening characteristics [14]. For circular vibrating screen, the motion of particles on the circular vibrating screen was analyzed [15].
This paper proposed a new vibrating type by the integration of swing and translation to improve the screening performance with the DEM-simulations. By using irregular movement of cams, a swing trace of the screen surface was produced. And the translation trace of the screen surface was produced by using eccentric wheels. Screening plate which follows complex traces in screening process of the proposed creative vibrating screen can result in motions of various amplitude and direction. While penetrating screen aperture along with the screen length, particles motion can lead the material to be well scattered. It contributes to augment both screening efficiency and processing capability. Meanwhile the parameters of laboratory-scale vibrating screen can be adjusted. Screening efficiency of physical experiment was calculated to validate the screening principle from the simulation data.
2. The motion equation of the new mode of translation combined with swing
As shown in Fig. 1, the motion model of translation vibrating screen was established. Screen surface is made simple harmonic motion along with the direction of vibration. The displacement of screen surface can be calculated by the following formula:
where is the amplitude along with the direction of vibration (mm); is the screen surface velocity (rad/s); is time (s); is the phase angle when the time is ().
So, the displacement, velocity, acceleration of screen surface in direction (parallel with screen surface) and direction (vertical with screen surface) components are followed:
where is the direction angle of vibration which is the angle between the screen surface with the direction angle when the particle away from the screen surface ().
Fig. 1Translation vibration screen motion model
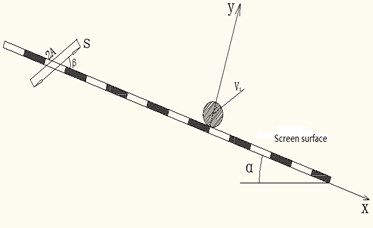
Fig. 2The motion model of swing vibrating screen
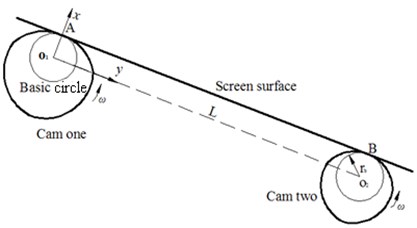
As shown in Fig. 2, the motion model of swing vibrating screen was established. The two camps are symmetrically distributed in the center of screen surface. They contact the screen surface directly, and the contours are different. According to the motion of the cams, two simultaneous different simple harmonic motions are produced, which lead to the swing motion of screen surface. Suppose the contact points of the two cams at the screen surface is A and B.
The motion equation of A:
Rise travel ():
Return travel ():
The motion equation of B:
Rise travel ():
Return travel ():
where is the displacement of A (mm); is the displacement of B (mm); is the stroke of cam one (mm); is the stroke of cam two (mm); is the rotation angle of cam (); is the angular velocity (rad/s); is the time (s).
The rotation center of cam one () is taken as the origin of a rectangular coordinate system. When the cams are rotating, the motion mode of the vibrating screen is:
where is the swing declination angle of screen surface (); is the distance of two rotation centers ( and ) (mm); is the maximum swing angle of screen surface.
3. Simulations and discussions
3.1. The contact model theory of simulation
A contact model describes how elements behave when they come into contact with each other. Here, an efficient and accurate force calculation is used. The contact model theory is based on the work of Mindlin [16, 17]. The normal force, , is given by:
where is the equivalent Young’s modulus, the equivalent radius and the normal overlap. Additionally, there is a damping force, , given by:
where is the equivalent mass, is the normal component of the relative velocity and and (the normal stiffness) are given by:
where is the coefficient of restitution. The tangential force, , depends on the tangential overlap and the tangential stiffness :
with:
Tangential damping is given by:
where is the relative tangential velocity. The tangential force is limited by Coulomb friction where is the coefficient of static friction.
For simulations in which rolling friction is important, this is accounted for applying a torque to the contacting surfaces:
with the coefficient of rolling friction, the distance of the contact point from the center of mass and the unit angular velocity vector of the object at the contact point.
3.2. Model of simulation
As shown in Fig. 3, a 3D simulation model of the new motion to simulate the screening process of the new mode of vibration consists of swing and translation realized by software called EDEM. The motion trajectory of each particle can be tracked during the screening process in consideration of advantages from EDEM. In the simulations, two sinusoidal rotations were set to represent the rotation of cams, which produce the screen surface with swing. The translation can be produced with EDEM, which can apply to the screen surface. At last, the new vibrating mode with swing and translation are coupled by the software.
The vibration screen model consists of four sections, which include screen box, screen surface, particle factory, and two cams. The screen box is 180 mm×33 mm×100 mm in volume. Undersize materials penetrate the screen apertures which were designed to be a square aperture 1mm and a wire diameter of 0.4 mm. Screen inclination is employed to enhance material flow and to improve the screening efficiency. The particle factory which generated particles is a virtual hole opened on the screen box. Particles fell on the screen surface by the function of gravity. Some small particles directly passed through the aperture as soon as they reached the screen surface and became an underflow stream, the others moved along with the screen length and became the overflow stream.
Fig. 3The new vibrating screen model
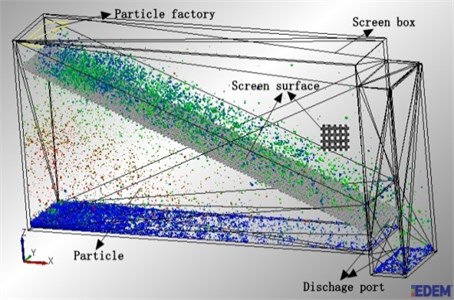
Table 1Simulation conditions
Material properties | Poisson’s ratio | Shear modulus | Density | |||
Particles | 0.3 | 23 MPa | 2678 kg/m3 | |||
Screen | 0.29 | 79.92 MPa | 7861 kg/m3 | |||
Collision properties | Coefficient of restitution | Coefficient of static friction | Coefficient of rolling friction | |||
Particle-particle | 0.1 | 0.545 | 0.01 | |||
Particle-screen | 0.2 | 0.5 | 0.01 | |||
Particle diameter | Mean 0.5 mm and 1 mm | Particle generation rate | 16666 Particle / s | |||
Screen aperture | 1 mm×1 mm | Particle generation position | In the particle factory, positioned randomly | |||
Screen declination | 21° | |||||
Screen vibration: Compound trace with swing and sinusoidal translation | ||||||
Test groups | Group 1 | Group 2 | Group 3 | Group 4 | Group 5 | |
Swing angle (°) | 0.5, 0.8, 1.1, 1.44, 1.8, 2.8, 3.6 | 1.44 | 1.1 | 1.1 | 1.1 | |
Swing frequency (Hz) | 15 | 5, 15, 25, 30, 35, 40, 50, 60, 70 | 15 | 15 | 15 | |
Amplitude (mm) | 2.1 | 2.1 | 1, 1.5, 1.8, 2.1, 2.5, 2.8, 3.8, 5.6 | 2.1 | 2.1 | |
Translation frequency (Hz) | 22 | 22 | 22 | 12, 18, 20, 22, 26, 40, 50, 60 | 22 | |
Translation direction angle (°) | 45 | 45 | 45 | 45 | 31, 36, 45, 56, 68, 81, 90 | |
According to the size distribution of sand used in the industry, the study used a bimodal normal distribution of particles to simulate the new vibration mode [18]. The density of spherical particles was 2678 kg/m3, which has similar properties to sand. In this paper, the sized particles consist of bimodal normal distribution with individual mean diameters of 0.5 mm and 1 mm. Each diameter’ standard deviation was 0.55. These particles properties are similar to properties of sands with the exception of regular shape. Spring-dashpot-slider model is used to simulate the particles collision on the screen surface [19, 20]. Meanwhile the particle initial velocity which is assumed to be 0 (m/s) and –0.05 (m/s) is assigned to all particles. Under the influence of vibration conditions, collisions from particles and particle-machine over the screen surface led to changes of particles velocities in each dimension, continuously. The particle properties, collision properties, and text groups are listed in Table 1. Five groups were set up to analyse the relationship between parameters and screening efficiency. The first group was conducted using various swing angles: 0.5, 0.8, 1.1, 1.44, 1.8, 2.8, and 3.6 mm, meanwhile the other were remain unchanged. For the second group, the swing frequency was varied: 5, 15, 25, 30, 35, 40, 50, 60, and 70 Hz. Different amplitudes of 1, 1.5, 1.8, 2.1, 2.5, 2.8, 3.8, and 5.6 mm were used for third group. The fourth group involved different translation frequencies: 12, 18, 20, 22, 26, 40, 50 and 60 Hz. The last group included various translation direction angles: 31, 36, 45, 56, 68, 81, and 90 degree.
3.3. Definition of screening efficiency in the simulation
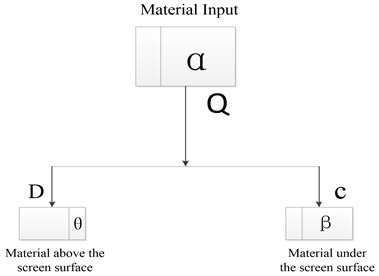
Screening efficiency is one kind of standards to judge whether the screening good or bad. Theoretically, all the particles whose sizes are smaller than that of aperture should pass through the aperture and down to the bottom of the screen box. The others should move forward above the screen surface until the end of the screen. Screening efficiency can be described as:
where is the mass of material under the screen surface (kg); is the mass of material input (kg); is the ratio of particles whose sizes are smaller than that of aperture under the screen surface; is the ratio of particles whose sizes are smaller than that of aperture among the material input.
However, due to the effects of the characters of material, device capabilities, and operation managements, there must be some particles whose sizes are bigger than separation size to pass through the aperture. So, we should consider that condition and definite the overall screening efficiency. The overall screening efficiency can be described as:
where is the overall screening efficiency. As shown in Fig. 5, the relationship between material input and output can be seen clearly and the overall screening efficiency can be understood easily. After simulation, the mass and position of each particle can be exported and the screening efficiency can be calculated.
Fig. 4Relationship between material input and output
3.4. The results of simulations
According to industrial experience, swing angle, swing frequency, amplitude, translation frequency, and translation direction angle have influence on the overall screening efficiency. Based on that, five group simulations have been set to find the relationship between these vibration factors and overall screening efficiency.
Fig. 5 presents how screening efficiency affects swing angle, , by collecting statistics for particles of varying sizes. At low swing angles ( 0.8°), screening efficiency increases with the increase of swing angle. At 0.8°, screening efficiency has a slight decline with swing angles. Optimum swing angle that was recommended at 0.8° can make the best screening performance in this particle system for the small sizes particles (0.7, 0.8 mm). But for the large particles (0.9 mm), more vibrating energy should be exerted to them which can improve the capability of stratification and looseness of particles to increase screening efficiency. Vibrating energy will increase with increasing swing angle. So, swing angle of 1.44° could be the optimum swing angle for the best performance of the current screening system for the larger size of particles (0.9 mm). However, the velocity in direction of particle increases with the increasing of swing angle. Because the screen length is constant, time of staying on the screen surface will decrease with the increase of velocity. Some of small particles which should be go through the aperture cannot have enough time and chances to go through sieve plate. The effected screening process led to decrease screening efficiency.
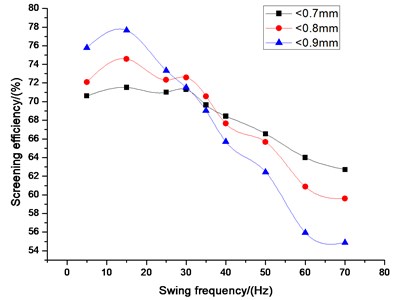
The simulated result of swing frequency on screening efficiency is presented in Fig. 6. For small size particles (0.7 mm), screening efficiency increases with increasing swing frequency at frequency less than 30 Hz, but slightly decreases after that point. However, for large size particles (0.8, 0.9 mm), screening efficiency increases with increasing swing frequency at frequency less than 15 Hz. After 15 Hz, screening efficiency sharply decreases with the increasing swing frequency. In conclusion, all kinds of sizes of particles have an optimum swing frequency for the best performance of the current screening system. Swing frequency of 15 Hz is suggested as the best frequency for the smaller size of particles (0.7 mm), and swing frequency of 30 Hz is the right frequency for the larger size of particles (0.8, 0.9 mm). At lower frequency, insufficient energy was exerted to the particles which can lead to particles stack on the screen surface and small particles cannot pass through the large particles’ gaps to the screen surface. So, screening efficiency is lower. With the increase of swing frequency, particles will have better stratification and looseness. Small particles can pass through the large particles’ gaps and screen aperture easily. Screening efficiency will increase in that case. If an oversize swing frequency was exerted to the screen surface, particles will be thrown higher and faster which lead them have no enough time and chances to pass through the screen aperture. So, the screening efficiency will decrease at higher swing frequency.
Fig. 5Influence of swing angle on screening efficiency
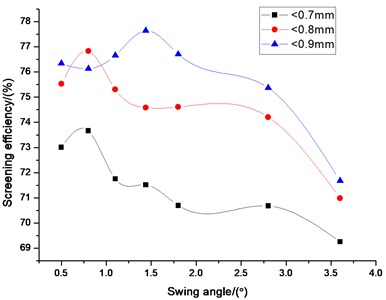
Fig. 6Influence of swing frequency on screening efficiency
In Fig. 7 curved lines presents simulation results about screening efficiency in different translation frequencies. For all kinds of particle sizes, screening efficiency increases with translation frequency at frequency less than 20 Hz, but decreases sharply after this point. This indicates that translation frequency of 20 Hz could be the optimum frequency for the best performance of the current screening system for all kinds of particle sizes. The reason why the translation frequency can affect the screening efficiency like this is the same as swing frequency. When translation frequency is far below or oversize, it is bad for stratification and looseness in screening process. Screening efficiency decrease along with the weak stratification and looseness.
Fig. 8 shows how the screening efficiency depends on translation direction angle, , for particles of different sizes. For all kinds of particle sizes, screening efficiency increases with translation direction angle first for angle less than 36°, but decreases sharply after this point and ends until 75°. For the angle more than 75°, screening efficiency increases with the increase translation direction angle. This indicates that translation direction angle of 36° is approximately the optimum point for all kinds of particle sizes. Appropriate translation direction angle is good to stratify and can make particles have appropriate velocity in direction which can make particles have enough time and chances to pass through the screen aperture. The phenomenon that the screening efficiency increases with the increasing translation direction angle for the angle more than 75° should be notable. When the translation direction angle is more than 75°, with adding the swing angle particles will be thrown back sometimes which can increase the probability of particles’ passing through the screen aperture. However, this extend the time of sieving.
Fig. 7Influence of translation frequency on screening efficiency
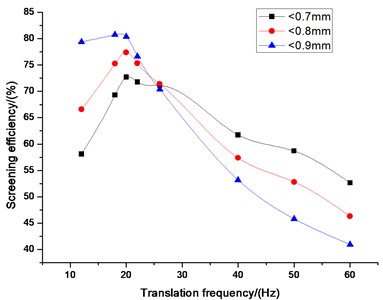
Fig. 8Influence of translation direction angle on screening efficiency
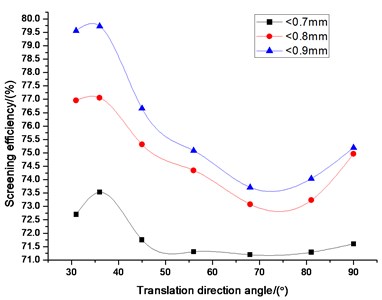
Fig. 9Influence of amplitude on screening efficiency
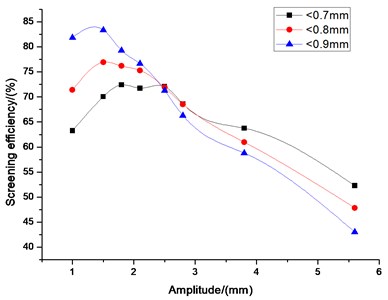
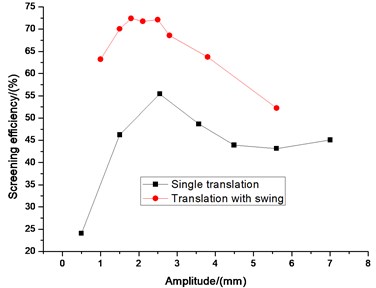
The simulated result of swing frequency on screening efficiency is presented in Fig. 9. We can see that in the beginning screening efficiency increases with amplitude for the magnitude less than 1.5 mm for large particles (0.8,0.9 mm), but decreases sharply after this point. However, for small particles (0.7 mm), screening efficiency increases with amplitude for the magnitude less than 2.5 mm, and decreases slightly after that point. Clearly, the rate of small particle size (0.7 mm) is smaller than that of large particle sizes (0.8, 0.9 mm). There are some reasons as bellows. For the constant length of screen surface, the particles penetration probability for small particles is bigger than that for large particles. So most small particles have been pass through the screen aperture at the feeding end of screen surface and only small part passes through screen aperture at the rest part of the screen surface. After expending the magnitude of amplitude, most small particles can still pass through screen aperture. So, screening efficiency of small particles decreases slowly and it tends to be stable with the increasing of amplitude. However, throwing velocity increases with the expending of amplitude, which can make large particles not have enough time to passing through the screen aperture. So, screening efficiency decreases sharply with the increasing of amplitude. Looking from the overall, all kinds of sizes of particles have an optimum swing frequency for the best performance of the current screening system. The amplitude of 1.5 mm is the critical value for large particles. Moreover, 2.5 mm is approximately the optimum point for the particle size of 0.7 mm.
4. Comparison of the effect of screening with the single motion of translation or swing
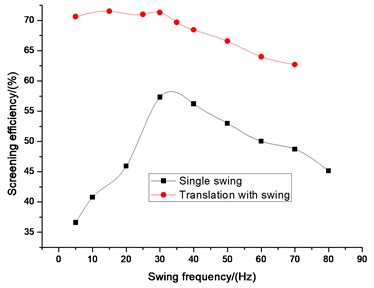
The comparisons of efficiency between single swing or translation and the new vibration mode (translation with swing) on different vibrating parameters which include swing angle, swing frequency, translation frequency, translation direction angle, and amplitude are illustrated in Fig. 10-14. Swing angle and swing frequency affect screening efficiency of swing mode. Translation frequency, translation amplitude and translation direction angle affects screening efficiency of translation mode. The screening efficiency under different vibration parameters in three vibration mode (Swing, translation and the two composite) are compared. Fig. 10-14 screening efficiency of new vibration mode is higher than single motion of translation or swing. It is obviously found that the screening efficiencies of vibrating screen of the new vibration mode are higher than that of single swing or translation based on different kinds of vibrating parameters. Therefore, it is reasonable for the vibrating screen of translation with swing trace to achieve the screening purposes.
Fig. 10Comparison efficiency between single swing and translation with swing on swing angle
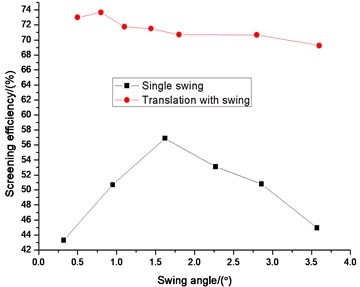
Fig. 11Comparison efficiency between single wing and translation with swing on swing frequency
5. Experimental verification
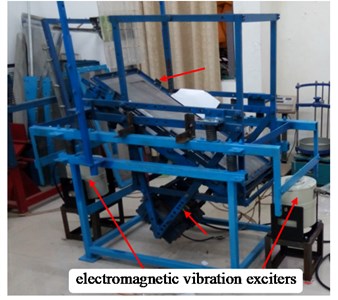
In this part, the laboratory-scale vibrating screen with the advantage of adjusted parameters was designed to conduct screening experiments. Realistic results were compared with simulation results for proving rationality of the simulation. Fig. 15 presents the laboratory-scale vibrating screen. The screen surface was derived by electric motors and electromagnetic vibration exciters. The electric motors drive the screen surface to translation and electromagnetic vibration exciters drive it to swing. Using the adjustable vibrating screen, the screening experiments in different vibration parameters can be completed. In simulation, diameter distribution of particles obeys a bimodal normal distribution with a standard deviation of 0.55. In physical experiments, sands were chosen as screened material. Fig. 16 showed that we mixed the different size particles which were screened by vibration screen based on shock type to match particle size distributions in simulation.
Fig. 12Comparison efficiency between single wing and translation with swing on translation frequency
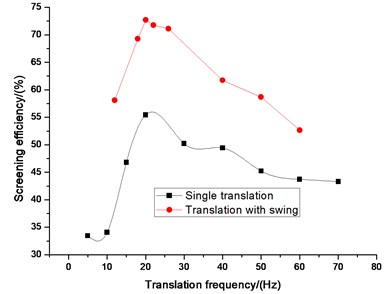
Fig. 13Comparison efficiency between single wing and translation with swing on translation direction angle
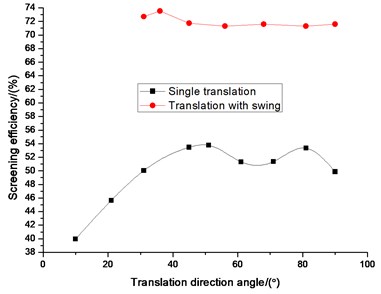
Fig. 14Comparison efficiency between single wing and translation with swing on amplitude
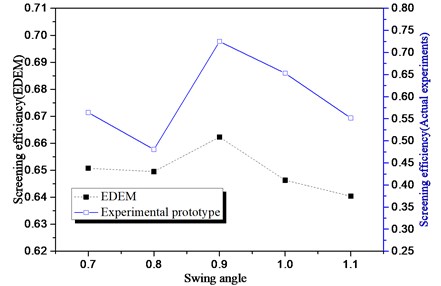
The size distributions of feed particles were determined by repeatedly weighing and then sieving it through a series of successively finer sieves with apertures ranging from 0.9 mm to 0.7 mm based on industrial screening. Other important conditions as follows: the processing capacity is 0.5 tons/hour; the screen panel consists of arrays of square hole which is 0.8 mm×0.8 mm; the wire diameter is 0.45 mm; the inclination angle is 30 degrees; the amplitude is 2.2 mm; the vibration direction angle is 75 degrees; the translation frequency is 18 Hz; the swing frequency is 10 Hz. In Fig. 17 two curved lines stand for realistic and simulation results about screening efficiency in different swing angles. Using DEM properties and conditions in numerical simulation are hardly to achieve exactly physical factors of the laboratory-scale vibrating screen. Diameter distribution of particles cannot be same between simulation and physical experiment because of the screen performance of vibration screen based on shock type. Meanwhile, the particles’ shape is another reason for the error. Particles shape has critical influence on movement of particles system by Cleary [21, 22]. In simulation, it’s hard to comprehensively and systematically describe the morphology of random particles. Despite the existence of errors, the general screening principles are consistent by tendency of the two curves listed in Fig. 17. It indicates that we can comprehend screening theory and make further screening research by using the numerical simulation method.
Table 2The size of distributions of feed particles for each experiment
Size (mm) | < 0.7 | 0.7-0.8 | 0.8-0.9 | > 0.9 |
Mass (g) | 150 | 70 | 50 | 30 |
Total mass (g) | 300 | |||
Fig. 15a) Photo of the composite vibrating screen and b) schematic showing the CAD model: 1 – vibration motor; 2 – screen surface; 3 – screen box; 4 – translation isolation springs; 5 – composite isolation springs; 6 – electromagnetic vibration exciters; 7 – support frame; 8 – base frame; 9 – collection bin; 10 – vibration motors mounting frame; 11 – vibration motors
a)
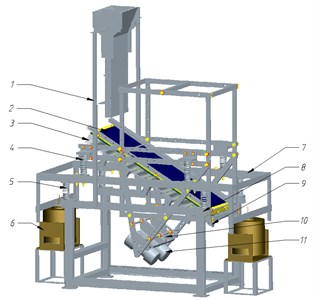
b)
Fig. 16The same feed particles in different groups used in experiments
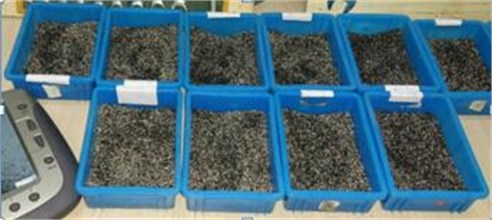
Fig. 17Comparison of experimental and simulation results
6. Conclusions
1) A creative vibration screen with compound trace with swing and translation was proposed, inspired by the manner of manual sieving. Particles at different parts on the screen surface experience different amplitudes and directions of compound trace with swing and translation, which can increase the screening efficiency effectively. Due to the translation exerted on the screen surface at the same time, this new creative vibration effectively prevents particles from blinding the screen aperture on the center of the screen surface comparing with single swing. It could contribute to increase screening efficiency and processing capacity.
2) The relationships between screening efficiency and vibration parameters, including swing angle, swing frequency, translation frequency, translation direction angle, and amplitude, were established. Different sizes of particles were examined. Some disciplines can be found by these relationships. Screening efficiency of vibrating screen of the new vibration mode is higher than that of single swing or translation. Therefore, it is reasonable for the vibrating screen of translation with swing trace to achieve the screening purposes.
3) The laboratory-scale vibrating screen with transformation parameters was created for validating the screening principle from the simulation data. Screening efficiency in simulation and experimental prototype are slightly different, but the general screening tendency is consisted in variable parameters.
4) The attention of practical application proposed will be the new creative vibration screen research focus. We will conduct stiffness and strength analysis to better serve the industry. Then the power consumption will be tested, the control of electricity and noise will be studied.
References
-
Jiao H. G., Ma J., Zhao Y. M., Chen L. J. Study on the numerical simulation of batch sieving process. Journal of Coal Science and Engineering, Vol. 12, Issue 2, 2006, p. 80-83.
-
Li, Z. F., Tong, X., Xia, H.H., Yu, L. J. A study of particles looseness in screening process of a linear vibrating screen. Journal of Vibroengineering, Vol. 18, Issue 2, 2016, p. 671-681.
-
Cleary P. W., Sawley M. DEM modelling of industrial granular flows: 3D case studies and the effect of particle shape on hopper discharge. Applied Mathematical Modelling, Vol.26, 2002, p.89-111.
-
Jiao H. G., Liu P., Ma J., Zhao Y. M. Development and application of screen simulation program by using particle discrete element method. Journal of Henan Polytechnic University, Vol. 6, 2008, p. 77-84.
-
Liu G. H., Tong X., Xin C. T. Numerical simulation of vibration screening process and its process. Metal Mine, Vol. 9, 2008, p. 104-110.
-
Cleary P. W., Sinnott M. D., Morrison R. D. Separation performance of double deck banana screens – Part 1: Flow and separation for different accelerations. Minerals Engineering, Vol. 22, Issue 14, 2009, p. 1218-1229.
-
Cleary P. W., Sinnott M. D., Morrison R. D. Separation performance of double deck banana screens – Part 2: Quantitative predictions. Minerals Engineering, Vol. 22, Issue 14, 2009, p. 1230-1244.
-
Dong K. J., Yu A. B., Brake I. DEM simulation of particle flow on a multi-deck banana screen. Minerals Engineering, Vol. 22, 2009, p. 910-920.
-
Li Z. F., Tong X. Modeling and parameter optimization for the design of vibrating screens. Minerals Engineering, Vol. 83, 2015, p. 149-155.
-
Zhong J., Yin H. Z., Han T. Simulation of particle flow on an elliptical vibrating screen using the discrete element method. Powder Technology, Vol. 302, 2016, p. 443-454.
-
Li Z. F., Tong X. Applications of the discrete element method and Fibonacci sequence on a banana screen. Journal of Engineering, Design and Technology, Vol. 15, Issue 1, 2017, p. 2-12.
-
Zhao L. L., Liu C. S., Yan J. X. A virtual experiment shoeing single particle motion on a linear vibrating screen-deck. Mining Science and Technology, Vol. 20, Issue 2, 2010, p. 276-280.
-
Xiao J. Z., Tong X. Characteristics and efficiency of a new vibrating screen with a swing trace. Particuology, Vol. 11, 2013, p. 601-606.
-
He X. M., Liu C. S. Dynamics and screening characteristics of a vibrating screen with variable elliptical trace. Mining Science and Technology, Vol. 19, Issue 4, 2009, p. 508-513.
-
Zhao L. L., Zhao Y. M., Liu C. S., Li J., Dong H. L. Simulation of the screening process on a circularly vibrating screen using 3D-DEM. Mining Science and Technology, Vol. 21, Issue 5, 2011, p. 677-680.
-
Standish N., Bharadwaj A. K., Hariri-Akbari G. A study of the effect of operating variables on the efficiency of a vibrating screen. Powder Technology, Vol. 48, 1986, p. 161-172.
-
Standish N. The kinetics of batch sieving. Powder Technology, Vol. 41, 1985, p. 57-67.
-
Chen Y. H. Numerical Simulation, Model and Optimistic Design of Vibrate Screening. Master Thesis, Huaqiao University, China, 2009, (in Chinese).
-
Wang G. F., Tong X. Screening efficiency and screen length of a linear vibrating screen using DEM 3D simulation. Mining Science and Technology, Vol. 21, 2011, p. 451-455.
-
Soldinger M. Interrelation of stratification and passage in the screening process. Minerals Engineering, Vol. 12, Issue 5, 1999, p. 497-516.
-
Cleary P. W. Large scale industrial DEM modeling. Engineering Computations, Vol. 21, 2004, p. 169-204.
-
Cleary P. W. DEM prediction of industrial and geophysical particle flows. Particuology, Vol. 8, 2010, p. 106-118.
Cited by
About this article

The authors gratefully acknowledged the support from the Program for Scientific and Technological Innovation Flats of Fujian Province (2014H2002). Key Projects of Fujian Provincial Youth Natural Fund (JZ160460). 51st Scientific Research Fund Program of Fujian University of Technology (GY-Z160139). No part of this paper has published or submitted elsewhere. The authors declared that they have no conflicts of interest to this work. All authors have seen the manuscript and approved to submit to your journal.
