Abstract
Pantographs are an important part of power supply systems of high-speed trains, whose good working performance is a guarantee for the steady power supply and safety operation of high-speed trains. The aerodynamic drag of pantographs will have negative impacts on the running of high-speed trains. In the meanwhile, the disturbance effect of pantographs on airflow will cause large aerodynamic noises when a high-speed train runs at a high speed. Therefore, this paper conducted a numerical simulation for the flow field and aerodynamic noises of pantographs on the symmetrical plane, compared simulation results with experimental one, verified the correctness of the numerical simulation model, and further studied the impact of pantograph angles on radiation noises. When pantographs were working, cylindrical rods which were vertical to the direction of airflows had a more obvious disturbance effect on airflows and caused a larger range of vortex shedding. Shedding vortexes were mainly distributed at the pantograph head, hinge joints between upper and lower arms, and rear bases. Near-field aerodynamic noises on the longitudinal symmetrical plane of pantographs were distributed at the lower arm, middle hinge joints and bases. The maximum appeared at the middle hinge joints. The intensity of vortexes at the middle hinge joints, lower arms and bases when the pantograph angle was 60° was more than that at other pantograph angles. In this case, the near-field aerodynamic noise of pantographs was more than that of other pantograph angles. In addition, radiation noises of observation points of pantographs in all directions presented an obvious linear relationship. The far-field radiation noise of pantographs was gradually decreased with the increased distance from pantographs. In addition, the far-field radiation noises of pantographs on the same vertical plane had the intensity with the same level.
1. Introduction
Pantographs are an important part of power supply systems of high-speed trains, whose good working performance is a guarantee for the steady power supply and safety operation of high-speed trains. The aerodynamic drag of pantographs will have negative impacts on the running of high-speed trains. In the meanwhile, the disturbance effect of pantographs on airflows will cause a large aerodynamic noise when a high-speed train runs at a high speed. Therefore, the aerodynamic characteristics and noises of pantographs have been the studied hotspot of science researchers due to the requirements for safety and comfort [1-6]. Li [7] established a three-dimensional geometric model of pantographs, simulated the flow field around pantographs based on the computational fluid dynamics and finite volume method and also built a computational model for the aerodynamic noise of pantographs. Researches showed that two regions where vortexes were distributed intensively, and aerodynamic noises were large were consistent with the aerodynamic noise source of pantographs. Du [8] used the computational fluid mechanics to compute the flow field of pantographs to study the aerodynamic noise distribution and spectrums of pantographs and obtain the fluctuation pressure on the surface of pantographs. On this basis, FW-H equations were then used to compute the far-field aerodynamic noise of pantographs. Results showed that the far-field aerodynamic noise of pantographs had an obvious directivity. Xiao [9] applied large eddy simulation and FW-H equations to the aerodynamic noise of pantograph insulators whose cross-section was a rectangle, round and oval respectively, and determined the cross-section shape of the optimal pantograph insulator. Mitsumoji [10] applied a flow control method to the pantograph head in order to reduce the aerodynamic noise of pantographs. Viscardi [11] presented a work deals with the aero-acoustic analysis on a three-dimensional pantograph model through adopting an innovative analytical approach. Li [12] adopted finite volume method based on three-dimensional steady and incompressible N-S equations to numerically simulate the aerodynamic force of pantographs and established a computational model for the aerodynamic lift force. The aerodynamic force of various parts of pantographs was related to pantograph angles. Tang [13] conducted numerical simulation on the aerodynamic load of pantographs in the tunnel inlet and outlet based on three-dimensional unsteady and compressible N-S equations. Guo [14] used detached eddy simulation (DES) to deeply study the unsteady aerodynamic characteristics of pantographs. Researches showed: The intensity and shedding frequency of shedding vortexes of pantographs had a great impact on the aerodynamic lift coefficient of pantographs.
This paper established a model of the three-dimensional aerodynamic noise of pantographs, experimentally verified the correctness of the computational model, further studied the near-field and far-field radiation noises of pantographs at different pantograph angles and provided a reference for designing low-noise pantographs.
2. Computational model of aerodynamic noises
Lighthill [15, 16] equations dated from researches on the jet flow noise and failed to consider the impact of moving boundaries on noises. Ffowcs-Williams and Hawkings extended Lighthill equations to the boundary of moving objects according to Lighthill acoustic analogy theories and obtained the following model for the aerodynamic noise of pantographs [17, 18]:
wherein: the first item at the right end of equations is a monopole sound source; the second item is a dipole sound source; the third item is a quadrupole sound source; is Lighthill tensor; and , , 0 is closed control plane; 0 is the region of flow field; 0 is fixed region; is Laplace operator; is Diraclet function; is Heaviside function; is sound velocity; is far-field sound pressure; is normal velocity on the surface of cover control plane; is air velocity vertical to the surface of cover control plane; is the density of static fluids; is the pressure of static fluids; is unit tensor; is unit stress tensor; is the component of unit normal vector on the surface of closed control plane; and are the component of air velocity.
In the flow of subsonic velocity, a quadrupole sound source was far less than dipole sound source and could be neglected. In the computation of aerodynamic noises, closed control plane was selected as the surface of pantographs. Suppose the surface of pantographs was rigid wall and monopole sound source was 0, the solution of Eq. (1) could be expressed as [19-21] at this time:
wherein: is the vector radius value from sound source point to far-field point; is the unit vector radius component from sound source point to far-field point; is the component of unit normal vector of closed control plane. It could be seen from equation (2) that the sound pressure value of aerodynamic noises of pantographs could use fluctuation pressure on the surface of pantographs for expression. In the case of computation, the computational model for aerodynamic characteristics was firstly applied to simulate the disturbed flow field of pantographs and obtain fluctuation pressure on the surface of pantographs. Then, the aerodynamic noise of pantographs was obtained through computing equation (2).
3. Numerical computation for the aerodynamic characteristics of pantographs
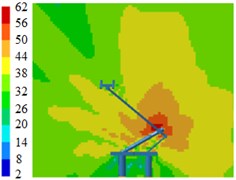
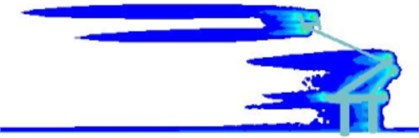
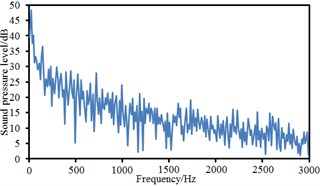
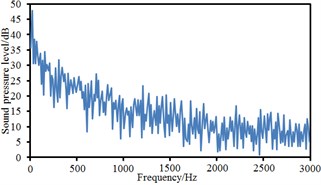
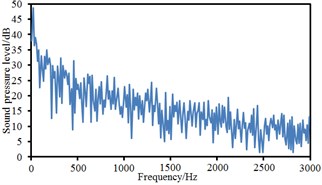
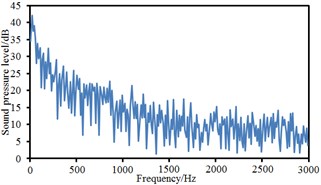
This paper did not consider the train body when computing the aerodynamic noise of pantographs. On one hand, aerodynamic noises have a very high requirement for computational grids. On the other hand, this paper had the following concern: The experimental result of circuit showed that the intensity of noise source at the top of pantographs was more than that at the bottom of pantographs, as shown in Fig. 1 [8].
Fig. 1Experimental test on the noise source distribution of the high-speed train [8]
![Experimental test on the noise source distribution of the high-speed train [8]](https://static-01.extrica.com/articles/18439/18439-img1.jpg)
a)
![Experimental test on the noise source distribution of the high-speed train [8]](https://static-01.extrica.com/articles/18439/18439-img2.jpg)
b)
![Experimental test on the noise source distribution of the high-speed train [8]](https://static-01.extrica.com/articles/18439/18439-img3.jpg)
c)
![Experimental test on the noise source distribution of the high-speed train [8]](https://static-01.extrica.com/articles/18439/18439-img4.jpg)
d)
3.1. Computational model for the aerodynamic characteristics of pantographs
Pantographs are a salient part at the top of trains, whose corner angle and concavo convex have very obvious geometrical characteristics. In consideration of technical problems including the computational time, hardware condition and computational process of server, accurately simulating the disturbed flow field of pantographs will consume a lot of resources and time. Therefore, it is necessary to appropriately simplify the studied model of pantographs. The control mechanism of pantographs is installed on chassis and composed of small parts like air duct and spring, and has little impact on the overall aerodynamic noise of pantographs. In view of the simplification of grid division and to retain its main aerodynamic characteristics, these small parts can almost be neglected. In addition, the control device of lifting and lowering pantographs is very complicated and occupies a lot of computer memory in the aspect of modeling and grid division. As a result, this paper neglected the contribution of lifting and lowering control device of pantographs to total aerodynamic noises and conducted modeling for pantographs. The simplified model of pantographs mainly contained pantograph head, upper and lower arms, push rods and bases. The simplified model was shown in Fig. 2.
Fig. 2Geometric model for the pantograph of the high-speed train
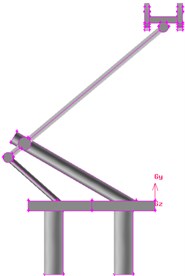
a) Side view
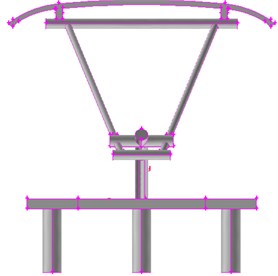
b) Front view
When a high-speed train is running, the computational domain for the flow field outside pantographs should be infinite in theories [22-24]. In addition, the accuracy of computational results will be improved with the increase of the computational domain. If the computational domain is infinite, the number of grids is also infinite. Meanwhile, requirements for computer performance will be higher and computational time will be longer. Therefore, the basic requirement for selecting the computational domain: Boundaries of the computational domain cannot interfere with the flow field of pantographs. The computational domain in this paper was set as 30m×6m×12m and pantographs were 0.2 m away from the ground, as shown in Fig. 3. This paper adopted structured grids and unstructured grids to divide pantographs together. Pantographs had irregular structure sizes and complex structures like bases. Therefore, unstructured grids were adopted on the surface of pantographs. To capture turbulent flow at the boundary layer on the surface of pantographs, the grids on the near surface layer of pantographs had to be refined in order to satisfy the requirements for computation. In the external region far away from pantographs, the impact of the train on the flow of airflows was decreased with the increase of distance from pantographs. Therefore, larger grids could be generated in the region far away from pantographs. Finally, structured grids could be used in a certain distance from pantographs in order to shorten the computational time.
Fig. 3Computational domain for the pantograph of the high-speed train
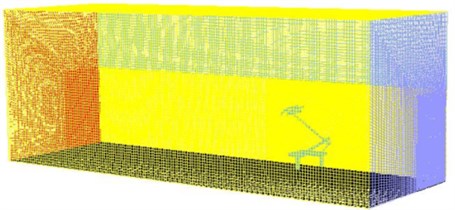
Any fluids are compressible. However, incompressible flow hypothesis can be adopted when the impact of changes in fluid density on flow can be neglected. Namely, density is a constant. In general, air can be considered as incompressible fluids when the running Mach number of moving objects in flow field is less than 0.3. The running speed of trains simulated and studied in this paper was 230 km/h; Mach number was 0.188, which was less than 0.3. Therefore, air around the train was incompressible gas. At this time, the impact on simulation results was very little. Fluid computation was conducted in a finite computational domain. Thus, boundaries of the computational domain had to set boundary conditions. Boundary conditions of flow field in this paper contained boundaries like the airflow inlet in the computational domain, pressure outlet and smooth wall. The airflow inlet plane in the computational domain gave a uniform inflow velocity along the direction of train length. The rear of pantographs was set as the outlet of atmospheric pressure. Other surfaces of solution domain were set as slip smooth walls.
3.2. Computation and verification for the aerodynamic characteristics of pantographs
Pantographs have many accessories. Therefore, it was necessary to experimentally verify the correctness of the computational model in order to ensure the analyzed accuracy in this paper. The pantograph studied in this paper was consistent with the experimental model in reference [25]. Therefore, a comparison between numerical computation and experimental test was made, as shown in Fig. 4. It could be found that the aerodynamic lift and drag of pantographs showed a good consistency with experimental one. As a result, the computational model for the pantograph in this paper was feasible.
Fig. 4Comparison of aerodynamic forces between experiment and simulation
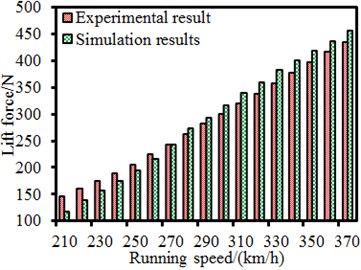
a) Lift force
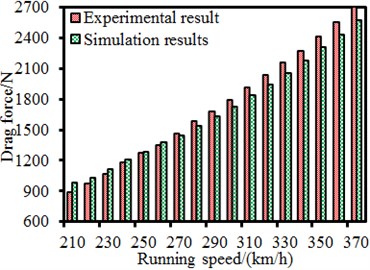
b) Drag force
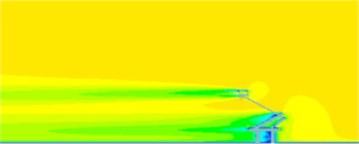
According to the computational model and boundary conditions, the flow field around pantographs was numerically computed, as shown in Fig. 5. The head, lower arms, middle hinge joints and bases of pantographs caused vortex shedding. Vortexes were mainly caused by cylindrical rods which were vertical to the direction of airflows at the hinge joint and the base of pantographs. Therefore, it could be inferred that the disturbance effect of cylindrical rods which were vertical to the direction of airflows on airflow was stronger than that of slant cylindrical rods. There were not a number of vortexes in the rear of pantographs because the size of vortexes caused by cylindrical rods was related to the size of cylindrical rods. The size of grids in the first layer of encrypted region was similar to the size of cylindrical rods. This kind of rough grids could not catch shedding vortexes of cylindrical rods. From pressure distribution, it could be seen that pressures were mainly distributed in the pantograph head, lower arms, middle hinge joints and bases.
4. Numerical computation for the near-field aerodynamic noise of pantographs
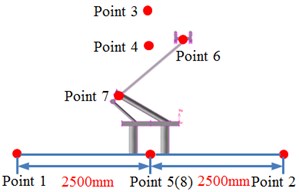
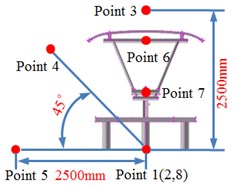
The aerodynamic characteristics of pantographs will cause the air fluctuation and then generate aerodynamic noises. Therefore, this paper adopted boundary element method to compute the aerodynamic noise of pantographs with considering acoustic-vibration coupling effect. Firstly, the surface of pantographs was extracted to establish the boundary element grids. Element type was tetrahedron and element size was 3 mm. Finally, the boundary element model contained 2,076 elements and 2,387 nodes. Secondly, the computational result for the aerodynamic characteristics of pantographs was imported into acoustic software. Thirdly, the computational result of aerodynamic characteristics was mapped to boundary element model. In this way, boundary element grids could obtain all results of aerodynamic characteristics of pantographs and realize acoustic-vibration coupling effect. The upper limit of the computed frequency was 3000 Hz and the computational step size was 20 Hz. To investigate the near-field aerodynamic noise of pantographs, 8 observation points were established around pantographs, as shown in Fig. 6. Observation point 1, 2, 3, 4 and 5 were 2.5 m away from the base center. Observation point 6, 7 and 8 were at the head, middle hinge joints and bases of pantographs.
Fig. 5Distribution of flow field of pantographs
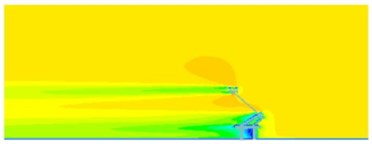
a) Velocity distribution
b) Vortex distribution

c) Pressure distribution
Fig. 6Observation points of radiation noises of pantographs
a)
b)
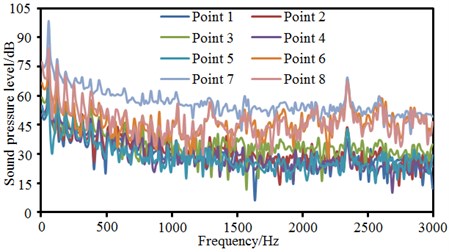
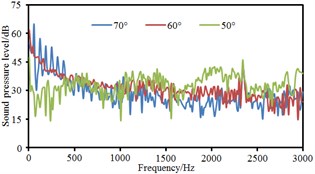
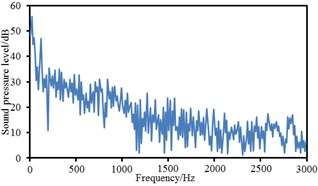
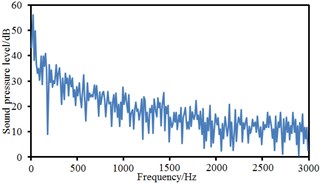
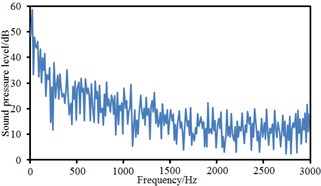
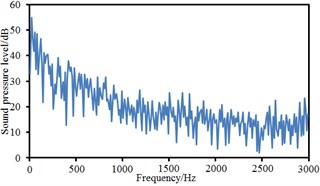
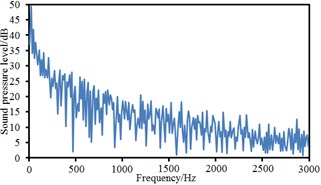
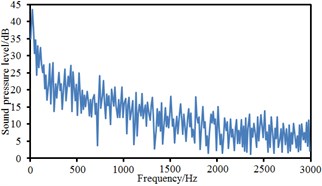
Sound pressure levels of 8 observation points were extracted, as shown in Fig. 7. It could be seen that change trends and size of sound pressures at observation points 1, 2, 3, 4 and 5 were similar as they kept the same distance from the pantograph. Sound pressure levels at observation points 6, 7 and 8 were obviously more than those at other 5 observation points because these three observation points were on the pantograph. Sound pressure levels at observation point 7 were the largest because it was at the middle hinge joint of pantographs. The cylindrical rods in this position were vertical to the direction of airflows and first interacted with airflows. Both 8 observation points showed an obvious peak noise about 2400 Hz.
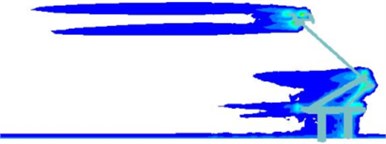
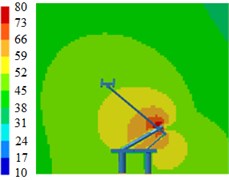
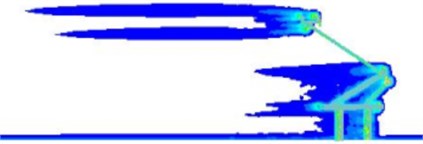
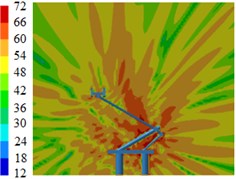
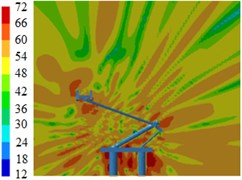
Fig. 8 displayed contours for the radiation noises of pantographs. Results showed that pantographs could cause large aerodynamic noises when the train ran at the speed of 230 km/h. Aerodynamic noises on the symmetrical plane in the near-field region of pantographs were relatively obvious, which indicated that pantographs were an important aerodynamic noise source of the high-speed train. Aerodynamic noises on the longitudinal symmetrical plane of pantographs were mainly distributed around the pantograph head, the hinge joint and the base. For the pantograph analyzed in this paper, the middle hinge joint of pantographs was where aerodynamic noise was the strongest.
Fig. 7Sound pressure levels at 8 observation points
Components in these positions of pantographs were vertical to the direction of airflows, had strong disturbance effect on airflows, caused an obvious vortex shedding and generated large aerodynamic noises. In addition, the radiation noise of the pantograph head was small when the analyzed frequency was low. The radiation noise of pantographs was highlighted when the analyzed frequency was 2000 Hz. In the whole analyzed frequency band, the radiation noise of middle hinge joints was very obvious.
Fig. 8Contours for the radiation noise of pantographs
a) 100 Hz
b) 500 Hz
c) 1000 Hz

d) 2000 Hz
5. Computation for near-field aerodynamic noises under different pantograph angles
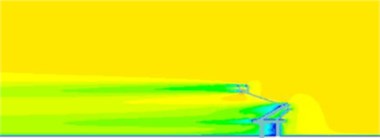
The pantograph angle for the mentioned computation was 70°. To study the impact of pantograph angles on the radiation noise of pantographs, the aerodynamic characteristics of pantographs were computed respectively when pantograph angles were 60° and 50°, as shown in Fig. 9 and Fig. 10. From the comparison between Fig. 5, Fig. 9 and Fig. 10, it could be seen that the intensity of vortexes at the middle hinge joint, lower arms and bases of pantographs was obviously more than that of other pantograph angles when pantograph angles was 60°. Vortexes were mainly caused by cylindrical rods which were vertical to the direction of airflows at the hinge joint and the base of pantographs. Therefore, it could be inferred that the disturbance effect of cylindrical rods vertical to the direction of airflow on airflow was stronger than that of slant cylindrical rods. There were not a number of vortexes in the rear of pantographs because the size of vortexes caused by cylindrical rods was related to the size of cylindrical rods. The size of grids in the first layer of encrypted region was similar to the size of cylindrical rods. This kind of rough grids could not catch the shedding vortexes of cylindrical rods. From pressure distribution, it could be seen that pressures were mainly distributed in the pantograph head, lower arms, middle hinge joints and bases.
Fig. 9Flow field distribution of pantographs under the pantograph angle 60°
a) Velocity distribution
b) Vortex distribution

c) Pressure distribution
Fig. 10Flow field distribution of pantographs under the pantograph angle 50°
a) Velocity distribution
b) Vortex distribution

c) Pressure distribution
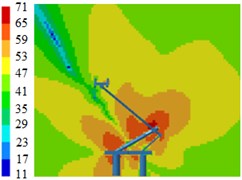
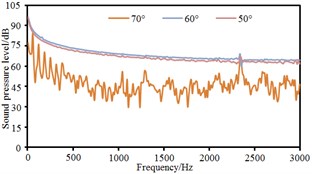
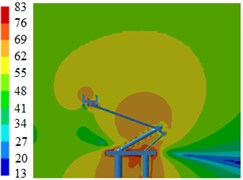
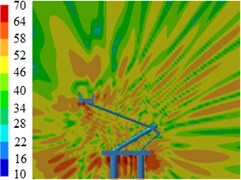
Based on boundary element method, radiation noises of pantographs were respectively computed under the pantograph angle 60° and 50° respectively to compare with that under the pantograph angle 70°, as shown in Fig. 11. It could be seen that the radiation noise at observation points 3 and 5 presented obvious fluctuations for the pantograph under the angle 60° while the radiation noise at other observation points basically presented a straight line. For the pantograph under the angle 50°, the radiation noise at observation points 4, 6, 7 and 8 were obviously linear. At various observation points, the radiation noises of pantographs under the angle 60° and 50° were obviously more than that under the angle 70°. The radiation noise of pantographs did not gradually increase with the decrease of pantograph angles. The radiation noise of pantographs under the angle 60° was the largest.
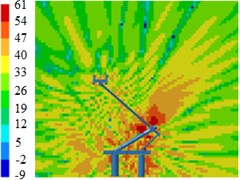
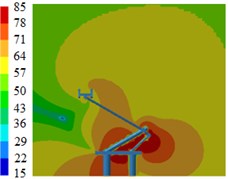
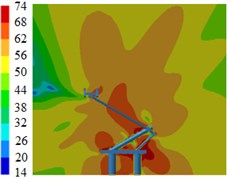
Contours for the radiation noises of pantographs under the pantograph angle 70°, 60° and 50° were extracted, as shown in Fig. 12, Fig. 13 and Fig. 14. The radiation noise sources of pantographs were still from its lower arms, middle hinge joints and bases when pantograph angles were 60°. In addition, upper arms showed certain radiation intensity. When pantograph angles were 50°, the lower part, middle hinge joints and bases of pantographs were main noise sources and the pantograph head also showed a strong radiation.
Fig. 11Comparison of radiation noises under different pantograph angles
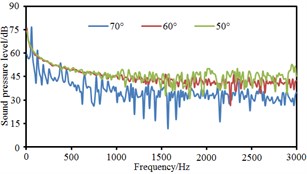
a) Point 1
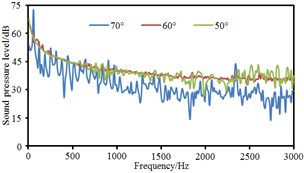
b) Point 2
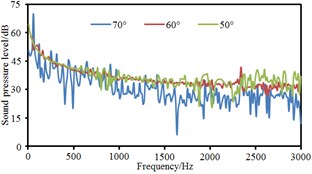
c) Point 3
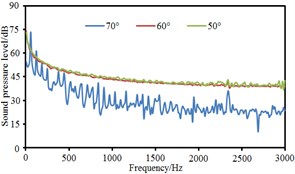
d) Point 4
e) Point 5
f) Point 6
g) Point 7
h) Point 8
Fig. 12Contours for the radiation noises of pantographs under the pantograph angle 70°

a) 100 Hz

b) 500 Hz

c) 1000 Hz
d) 2000 Hz
Fig. 13Contours for the radiation noises of pantographs under the pantograph angle 60°
a) 100 Hz
b) 500 Hz
c) 1000 Hz
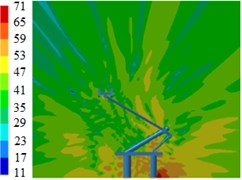
d) 2000 Hz
Fig. 14Contours for the radiation noises of pantographs under the pantograph angle 50°
a) 100 Hz
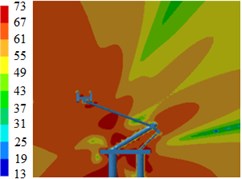
b) 500 Hz
c) 1000 Hz
d) 2000 Hz
6. Numerical computation for the far-field aerodynamic noise of pantographs
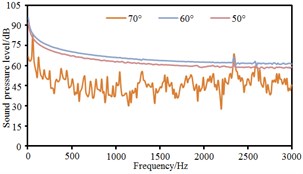
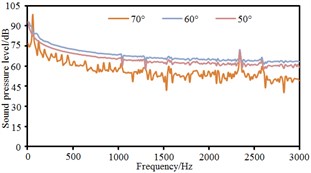
Only the near-field radiation noises of pantographs were studied above. However, the high-speed running of trains will also seriously impact the far-field environment. Therefore, it was also necessary to analyze the far-field radiation noise of pantographs. The geometric shape of pantographs was strictly symmetrical. To study the far-field aerodynamic noise characteristics of the high-speed train, this paper arranged 8 observation points which were 7.5 m and 15 m away from the center line of railway track and 2 m, 4 m, 6 m and 8 m from the track ground and set 2 observation points which was 25 m away from the center line of railway track at the right side of pantographs and 2 m and 4 m from the track ground. There were 10 observation points in total. The distribution of various observation points was shown in Fig. 15.
Observation points 1, 2, 3 and 4 were on the same vertical plane. Corresponding radiation noises were also at the same level. For observation points 1 and 2, their radiation noises presented an obvious valley value at 200 Hz and were gradually decreased with the increase of the analyzed frequency. However, their radiation noises basically tended to be a stable value when the analyzed frequency was more than 1000 Hz. Similarly, observation points 5, 6, 7 and 8 were also on the same vertical plane and their radiation noises were at the same level. However, their radiation noises showed an obvious valley value at 500 Hz and were gradually decreased with the increase of the analyzed frequency. Their radiation noises tended to be a relatively stable value when the analyzed frequency was more than 1000 Hz. Observation points 9 and 10 were similar in change situation and noise level. In addition, the sound pressure level of radiation noises was gradually decreased and reduced to final 45 dB from initial 60 dB with the increase of horizontal distance of observation points. We also computed the total noise of pantographs in the far-field, and then compared it with experimental one, as shown in Table 1. It can be seen from Table 1, the error between numerical simulation and experimental test is small, so that the computational model of the aerodynamic noise of pantographs is reliable.
Fig. 15Observation points of far-field noises of pantograph
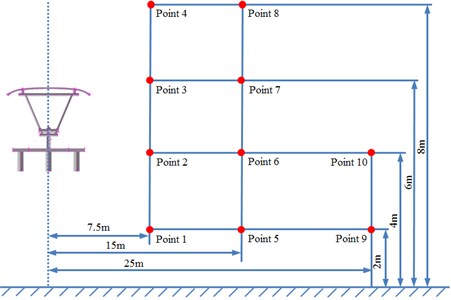
Fig. 16Sound pressure levels at 10 observation points
a) Point 1
b) Point 2
c) Point 3
d) Point 4
e) Point 5
f) Point 6
g) Point 7
h) Point 8
i) Point 9
j) Point 10
Table 1Comparisons of total noises between experimental test and numerical simulation
Observation points | Numerical simulation / dB | Experimental test / dB | Relative error / % |
1 | 62.3 | 65.2 | –4.44 |
2 | 64.1 | 62.3 | 2.89 |
3 | 65.1 | 66.8 | –2.54 |
4 | 61.2 | 59.4 | 3.03 |
5 | 54.3 | 57.5 | –5.56 |
6 | 53.2 | 56.1 | –5.17 |
7 | 52.8 | 50.3 | 4.97 |
8 | 53.1 | 56.2 | –5.51 |
9 | 47.4 | 45.6 | 3.95 |
10 | 48.2 | 50.5 | –4.55 |
7. Conclusions
This paper conducted a numerical simulation for the flow field around pantographs and radiation noises on the symmetrical plane, compared simulation results with experimental one, verified the correctness of numerical simulation model, and further studied the impact of pantograph angles on radiation noises. When pantographs were working, cylindrical rods which were vertical to the direction of airflows had a more obvious disturbance effect on airflows and caused a larger range of vortex shedding. Shedding vortexes were mainly distributed at the pantograph head, hinge joints and bases. Near-field aerodynamic noises on the longitudinal symmetrical plane of pantographs were distributed at the lower arm, middle hinge joints and bases. The maximum appeared at the middle hinge joint. The intensity of vortexes at the middle hinge joint, lower arms and bases when the pantograph angle was 60° was obviously more than that under other pantograph angles. In this case, the near-field aerodynamic noise of pantographs was obviously more than that under other pantograph angles. In addition, radiation noises at observation points of pantographs in all directions presented an obvious linear relationship. The far-field radiation noise of pantographs was gradually decreased with the increased distance of observation points. In addition, the far-field radiation noises of pantographs on the same vertical plane had the intensity with the same level.
References
-
Siano D., Viscardi M., Donisi F., et al. Numerical modeling and experimental evaluation of an high-speed train pantograph aerodynamic noise. Computers and Mathematics in Automation and Materials Science, 2011, p. 86-92.
-
Wei W., Song H., Li W., et al. Gradient-driven parking navigation using a continuous information potential field based on wireless sensor network. Information Sciences, Vol. 408, 2017, p. 100-114.
-
Sueki T., Ikeda M., Takaishi T., et al. Reduction of aerodynamic noise from high-speed pantograph using porous materials. Journal of Environment and Engineering, Vol. 5, Issue 3, 2010, p. 469-484.
-
Takaishi T., Sagawa A., Chisachi K. Numerical analysis of aerodynamic noise emitted from a pantograph based on non-compact Green’s function. Journal of Environment and Engineering, Vol. 5, Issue 1, 2010, p. 84-96.
-
Yu H. H., Li J. C., Zhang H. Q. On aerodynamic noises radiated by the pantograph system of high-speed trains. Acta Mechanica Sinica, Vol. 29, Issue 3, 2013, p. 399-410.
-
Lee Y., Rho J., Kim K. H., et al. Experimental studies on the aerodynamic characteristics of a pantograph suitable for a high-speed train. Proceedings of the Institution of Mechanical Engineers, Part F: Journal of Rail and Rapid Transit, Vol. 229, Issue 2, 2015, p. 136-149.
-
Li H., Xiao X. B., Li Z. H., Zhu M. H., Jin X. S. Preliminary investigation into aerodynamic noise of a certain type of pantograph under speed of 300 km/h. Journal of The China Railway Society, Vol. 38, Issue 9, 2016, p. 18-22.
-
Du J., Liang J. Y., Tian A. Q. Analysis of aerodynamics characteristics for pantograph of high-speed trains. Journal of Southwest Jiaotong University, Vol. 50, Issue 5, 2015, p. 935-941.
-
Xiao Y. G., Shi Y. Aerodynamic noise calculation and shape optimization of high-speed train pantograph insulators. Journal of Railway Science and Engineering, Vol. 9, Issue 6, 2012, p. 72-76.
-
Mitsumoji T., Sueki T., Yamazaki N., et al. Aerodynamic noise reduction of a pantograph panhead by applying a flow control method. Noise and Vibration Mitigation for Rail Transportation Systems. Notes on Numerical Fluid Mechanics and Multidisciplinary Design, Vol. 126, 2015, p. 515-522.
-
Viscardi M., Siano D., Napolitano P., et al. An analytical model for the aerodynamic noise prediction of an high-speed train pantograph. Applied Informatics and Communications, 2014, p. 271-280.
-
Li R. P., Zhou N., Zhang W. H., Mei G. M., Chen Z. B. Calculation and analysis of pantograph aerodynamic uplift force. Journal of The China Railway Society, Vol. 34, Issue 8, 2012, p. 26-32.
-
Tang X., Zhou D., Liang X. F. Aerodynamic load on pantograph of high-speed train passing into and out of tunnels. Journal of Central South University (Science and Technology), Vol. 46, Issue 5, 2015, p. 1923-1928.
-
Guo D. L., Yao S. B., Liu C. H., Yang G. W. Unsteady aerodynamic characteristics of high-speed pantograph. Journal of The China Railway Society, Vol. 34, Issue 11, 2012, p. 16-21.
-
Lighthill M. J. On sound generated aerodynamically. I General theory. Proceedings of the Royal Society of London, Series A, Mathematical and Physical Science, Vol. 211, Issue 1107, 1952, p. 564-587.
-
Lighthill M. J. On sound generated aerodynamically. II Turbulence as a source of sound. Proceedings of the Royal Society of London, Series A, Mathematical and Physical Science, Vol. 222, Issue 1148, 1952, p. 1-32.
-
Ffowcs W. J. E., Hawkings D. J. Sound generation by turbulence and surfaces in arbitrary motion. Philosophical Transactions of Royal Society of London, Vol. 264, 1969, p. 321-342.
-
Li J., Huang L., Zhou Y., et al. Computation partitioning for mobile cloud computing in a big data environment. IEEE Transactions on Industrial Informatics, Vol. 13, Issue 4, 2017, p. 2009-2018.
-
Liu J. L., Zhang J. Y., Zhang W. H. Numerical analysis on aerodynamic noise of the high-speed train head. Journal of the China Railway Society, Vol. 33, Issue 9, 2011, p. 19-26.
-
Yang K., Yang J., Wu J. S., et al. Performance analysis of DF cooperative diversity system with OSTBC over spatially correlated Nakagami-m fading channels. IEEE Transactions on Vehicular Technology, Vol. 63, Issue 3, 2014, p. 1270-1281.
-
Liu J. L., Zhang J. Y., Zhang W. H. Study of computational method of far-field aerodynamic noise of a high-speed train considering ground effect. Chinese Journal of Computational Mechanics, Vol. 30, Issue 1, 2013, p. 94-100.
-
Li J., Deng G., Luo C., et al. A Hybrid path planning method in unmanned air/ground vehicle (UAV/UGV) cooperative systems. IEEE Transactions on Vehicular Technology, Vol. 65, Issue 12, 2016, p. 9585-9596.
-
Wei W., Fan X., Song H., et al. Imperfect information dynamic stackelberg game based resource allocation using hidden Markov for cloud computing. IEEE Transactions on Services Computing, 2016, https://doi.org/10.1109/TSC.2016.2528246.
-
Ding G. M., Tan Z. H., Wu J. S., et al. Efficient indoor fingerprinting localization technique using regional propagation model. IEICE Transactions on Communications, Vol. 97, Issue 8, 2014, p. 1728-1741.
-
Zhang Y. S., Jia Y., Lv L. X., Yin S. B., Lang W. D. Experimental study of high-speed train pantograph in wind tunnel. Journal of Experimental Mechanics, Vol. 29, Issue 1, 2014, p. 105-111.
About this article

