Abstract
The vibration of the machine tool has important effect on machining quality of parts. So, in this paper, the dynamic behavior and modal parameters of the vertical moving table of the 4-DOF parallel machine tool are studied using the FEM and experimental methods. The prepared model of the vertical moving table in Solidworks is exported to ANSYS environment. Then, its natural frequencies and mode shapes are extracted using the modal analysis. Then having the FEM results, the exact modal data of the vertical moving table is obtained by the experimental tests. The exciting conditions of the machine tool table are obtained through modeling of machining operations. Finally, the resonance situations of the table are found using the modal data of the table and the cutting parameters of the machine tool. The results of this research can help the machine tool operator to avoid the vibration condition through correct selection of the cutting parameters.
1. Introduction
The vibration conditions of a structure in a given frequency range can be modeled using the individual modes of vibration. The natural or resonance frequencies and modal damping mode shapes are known as the modal parameters. Achieving the modal parameters of a structure helps that the vibration problems caused by the resonance conditions can be detected [1]. Finding the accurate dynamic behavior of machine tool structures is still a complicated and tedious work. However, some considerable advanced methods have been achieved in the development of experimental methods for determination of the mode shapes of machine tool structures as well as parallel kinematic mechanisms. Several researchers have studied the vibration analysis of the machine tool structures involved in machining system using their stiffness measurements and modal analysis [2-4].
Yuan et al. [5] employed the finite element method for modal analysis of machine tool structures. In their study, ten natural frequencies and mode shapes of the machine tool’s structure were determined. Patwari et al. [6] presented a systematic procedure and the use of experimental and analytical modal analysis for a structural dynamic evaluation of a vertical machine center. Zhijun et al. [7] studied an approach through modal analysis and harmonic response to analyze the characteristics of machine tools. They introduced the dynamic theory and modeling method of MDOF systems. They also carried out modal analysis experiments to obtain modal frequencies and mode shapes. Herman et al. [8] proposed numerical and experimental investigations to the detection of defects in composite T-stiffened panels using vibration modal analysis. Experimental testing revealed that the vibrational excitation of the defective panels altered the vibration mode response. Zoury et al. [9] presented the experimental and analytical modal analysis of a crankshaft. In their research, the effective material and geometrical properties were measured and the dynamic behavior was investigated through impact testing. Then, the three-dimensional finite element models were constructed and an analytical modal analysis was performed to generate natural frequencies and mode shapes. Cakir and Uysal [10] assessed the modal parameters and dynamic responses of the brick masonry arches strengthened with polymer composites by experimental and numerical tests. Moreover, several modal analysis have been reported in the literature [11, 12] to extract the vibration frequencies and modes of various industrial structures such as rotor system, aerospace structures and etc. Pakzad et al. [3] and Pedrammehr et al. [13, 14] have studied the dynamic parameters of different types of the grinding and milling machines using experimental modal analysis and the results are compared by the finite element study. Mahboubkhah et al. [15] utilized modal analysis of the hexapod table to investigate the proper machining conditions of different configurations.
However, in the most of researches, the results of modal analysis have been rarely used to give an appropriate approach to the machine tools operator. Usually these results have been used to verify FE modeling. Chen et al. [16] were applied the analytical modal analysis on planar parallel robot with 2-Dof and flexiable pods. They used the Abaqus software to verify their analytical model. Moreover, the modal analysis results have been used to extract and optimize the design weakness features of robots. Sahu et al. [17] were analyzed vibrational modes of natural frequencies of an industrial 6-Dof robot by FEM method and ANSYS Workbench software, considering existence and absence of crack in its structure. They finally recognized the weakest parts of robot and optimized the design. Guo et al. [18] were analyzed an amphibious spherical robot in ANSYS Workbench to extract its natural frequencies and mode shapes. They were also applied fatigue analysis on robot parts to obtain the optimum design.
The current paper is focused on the dynamic properties of a vertical moving table in which, is used in a parallel mechanism machine tool at its resonance frequencies. All these properties are identified by the FEM analysis and experimental tests. For this purpose, a model of the vertical moving table is prepared in Solidworks, then the CAD model is exported to ANSYS Workbench environment. In ANSYS software the modal analysis is applied to extract the natural frequencies and mode shapes of the structure. The extracted results by FEM are further applied by experimental modal test to obtain the exact modal data of the structure. In the experimental test, the table vibration is excited by a shaker and the response of excited points is measured through accelerometer sensors. The measurement points of vibration are selected at the key positions of the table. Finally, the results of experimental tests are applied to avoid their resonance conditions by selecting the best machining parameters such as spindle speed and location of machine tool table.
2. Introducing the 4Dof parallel machine tool
In this paper, a 4Dof parallel robot machine tool with a vertical moving table was analyzed. This machine tool is constructed of four pods that are connected a moving platform. The pods have constant lengths. The DOF of this robot includes three linear displacements in , and directions and a rotation around the axis. The fourth DOF of present mechanism increases the maneuverability and its performance regarding the other 3DOF parallel mechanisms. The proposed robot has two similar pairs of pods, includes 2-PR(Pa)U and 2-PR(Pa)R in which P, R, Pa, U represents prismatic, revolute, parallelogram and universal joints respectively. The parallelogram has the greater stiffness in comparison with a simple chain. The robot configuration is designed in the manner to have the best stiffness and suitable workspace form.
3. Vertical moving table of machine tool
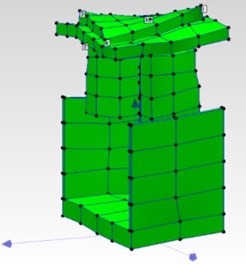
Whereas, the different points of parallel machine tool workspace have not the similar stiffness, a moving table with the extra vertical moving capability (in the direction) is equipped to the machine assembly. The machining operation is preferred to be done in the highest portion of the workspace due to highest stiffness of robot in this portion. The vertical moving table shown in Fig. 1 can set the position of moving platform in the workspace with suitable stiffness. However, by changing the height of the vertical moving table, its stiffness and natural frequencies are changed.
4. Modeling method and FEM modal analysis
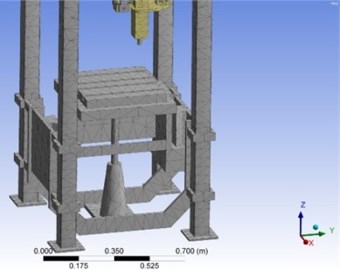
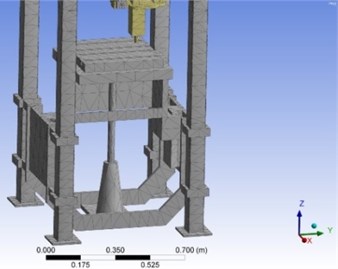
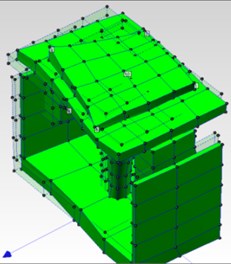
As is mentioned before, the vertical moving table of parallel machine tool can move in vertical axis, therefore the CAD modeling of the table is done in the lowest and highest locations of the table by the Solidworks software. Then the model is exported to the ANSYS Workbench environment and the significant specifications such as material properties (modulus of elasticity, poison ratio and density) are applied. The structure of machine tool was meshed by the Solid187 element. The meshing model (Fig. 2) has 6952 elements and 14231 nodes. The boundary conditions are described on the structure consist of fixed displacements of bases and a suitable contact pair between parts. Finally, modal analysis was done on finite element model of vertical moving table structure via ANSYS Workbench and the seven first natural frequencies were extracted according to Table 1.
The natural frequencies that extracted by FEM modal analysis are appreciable by the mode shapes. As an example, Torsion Mode shape of the table in its highest location around axis at a natural frequency of 480.92 (Hz) and Torsion mode shape of the table in its lowest location around axis at a natural frequency of 280.05 (Hz) are shown in Fig. 3.
Fig. 1Vertical moving table of parallel machine tool
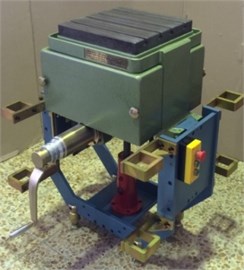
Fig. 2The meshed models of vertical moving table in lowest and highest locations
a)
b)
5. Experimental modal test of structure
The important stages of the experimental modal test of the vertical moving table are: At first, applying the appropriate boundary conditions, so that the exciting forces are enforced; then, measuring the excited forces simultaneous with their displacement responses; finally, extracting the modal parameters through the frequency response functions (FRF’s).
Table 1Natural frequencies obtained by FEM modal analysis
Mode No. | Natural freq. in highest location (Hz) | Natural freq. in lowest location (Hz) | Mode shape |
1 | 178.2 | 193.5 | Torsion around |
2 | 267.26 | 280.05 | Torsion around |
3 | 298.66 | 313.71 | Torsion around |
4 | 441.41 | 486.72 | Torsion around and |
5 | 480.92 | 492.11 | Torsion around |
6 | 766.89 | 777.08 | Bending around |
7 | 898.63 | 913.33 | Bending around and Torsion around |
Fig. 3Two mode shapes of table in its lowest and highest locations in ANSYS
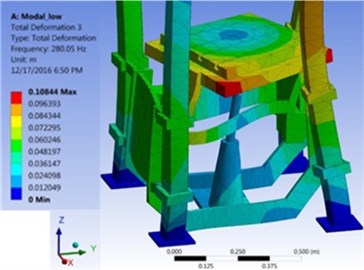
a) Torsion mode shape around axis (280 Hz)
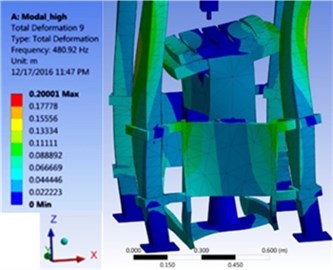
b) Torsion mode around axis (480 Hz)
In the experimental modal test of mentioned vertical moving table, the accelerometer (B&K Inc., type 4507), the force transducer (B&K Inc., type 8201) and the vibration exciter (B&K Inc., type 4809) were applied. Pulse system (B&K Inc., type 3560) analyzes the accelerometer signals and the force of exciter. Considering the exclusive boundary condition of the table with fixed DOFs in base and robot columns connection, the method of roving accelerometer is selected (Fig. 4).
Fig. 4Experimental modal test of vertical moving table
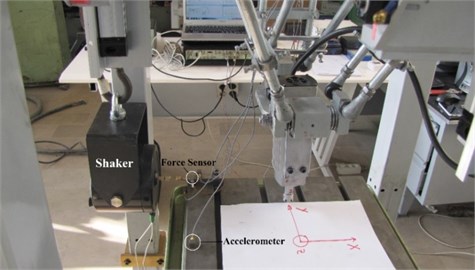
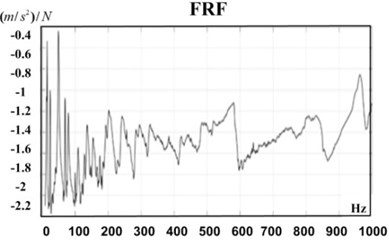
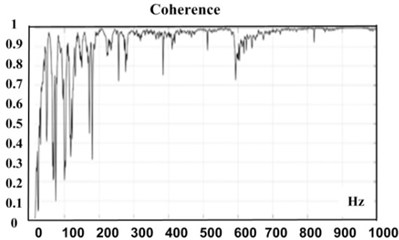
In the present roving accelerometer method, the shaker force was applied in a described point of the table (corner of the table in direction) and then, acceleration responses of eight specified points of the table structure were measured by the accelerometer in the , and directions separately; thus 24 different responses were collected for different directions and points. Then FRF of the system were extracted between the mentioned points using Fast Fourier Transform (FFT) algorithm. The results were analyzed and presented as FRF diagrams using PULSE Labshop software for specified points of the table. As an example, one of the extracted FRFs and its coherence is shown in Fig. 5.
Using the ME 'Scope modal analysis software, the natural frequencies of the experimental test were extracted. According to obtained results of FEM, the measured frequency domain is selected to be in the range of 0-1000 Hz. Seven first natural frequencies of the structure were evaluated and are presented in Table 2.
Fig. 5An example of extracted FRF and its coherence
a)
b)
Table 2Natural frequencies obtained by experimental modal test
Mode No. | Natural frequency in highest location (Hz) | Natural frequency in lowest location (Hz) | Mode shape |
1 | 178 | 165 | Torsion around |
2 | 266 | 271 | Torsion around |
3 | 322 | 327 | Torsion around |
4 | 430 | 478 | Torsion around and |
5 | 479 | 517 | Torsion around |
6 | 764 | 779 | Bending around |
7 | 887 | 940 | Bending around and Torsion around |
As an example, torsion mode shape of the table in its highest location around axis at a natural frequency of 480.92 (Hz) and torsion mode shape of the table in its lowest location around axis at a natural frequency of 280.05 (Hz) are shown in Fig. 6.
Fig. 6Two sample torsion mode shapes of table in Me’scope software
a) In highest stroke, around axis at natural frequency of 479 (Hz)
b) In lowest stroke, around axis at natural frequency of 271 (Hz)
6. Comparison between the results of FEM and experimental modal test
Related natural frequencies of both FEM and experimental modal test and the difference of two methods are listed in Table 3 and are shown in Fig. 7. The comparison between natural frequencies of finite element modeling and experimental model testing shows the closeness of their results. According to these results, with increasing the height of table, its natural frequencies decrease due to reducing its stiffness.
Table 3Correspondence natural frequencies results of FEM and modal test
Moving table location | Natural frequency via FEM (Hz) | Natural frequency via modal test (Hz) | Difference of two methods (%) |
Highest | 178.2 | 178 | 0.11236 |
267.26 | 266 | 0.473684 | |
298.66 | 322 | 7.248447 | |
441.41 | 430 | 2.653488 | |
480.92 | 479 | 0.400835 | |
766.89 | 764 | 0.378272 | |
898.63 | 887 | 1.311161 | |
Lowest | 193.5 | 165 | 17.27273 |
280.05 | 271 | 3.339483 | |
313.71 | 327 | 4.06422 | |
486.72 | 478 | 1.824268 | |
492.11 | 517 | 4.814313 | |
777.08 | 779 | 0.24647 | |
913.33 | 940 | 2.837234 |
Fig. 7Natural frequencies of FEM and experimental modal test
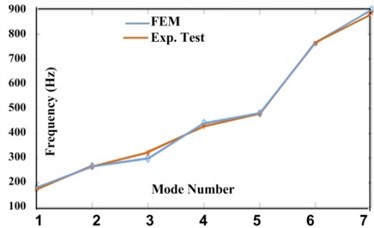
a) In the highest location
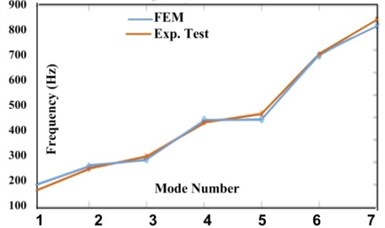
b) In the lowest location
7. Proposing the best machining condition
In the previous steps, natural frequencies of machine tool table were found. It is obvious that to avoid resonance in machining operation, the natural frequencies of moving table in which depends on its position should be far away from the exciting frequencies.
The exciting frequencies, (Hz) according to Eq. (1) depend on machining condition such as , spindle speed (rpm) and , number of tool tooth:
The compatible spindle speeds (using 2.4) with the natural frequencies of the vertical moving table according to Table 3 are presented in Table 4. Therefore, to avoid resonance conditions, by using these information, the operator can select the best spindle speed, teeth of tool and location of the table according to machining conditions. The employed spindle in this study is (Hertz HMA 42D 24000 rpm). For an instance, according to Table 3, the natural frequencies ranges in highest location of the table are 178-887 Hz and in the lowest location are about 165-940 Hz. Also, if the spindle speed is 24000 rpm and 2, machining frequency will be 800 Hz and consequently, the corresponding nearest frequency in the highest location of the table is 764 Hz and in the lowest location of the table is 779 Hz. Therefore, it is preferred that the machining operation is done in the highest location of the table. To confirm this claim according to table4, the following case study is performed in Ansys environment.
7.1. A case study
In the present case study, a workpiece is located on the machine tool's table in its lowest position, in which numbers of tool teeth are 2 and spindle speed according to cutting condition is required to be about 9000-10000 rpm.
Fig. 8Maximum total deformation of table in deferent induced frequencies
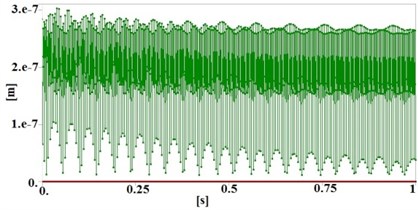
a) In 300 Hz
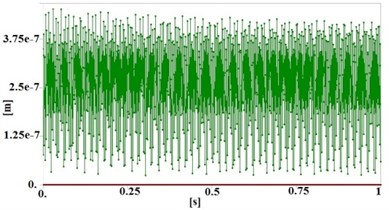
b) In 325 Hz
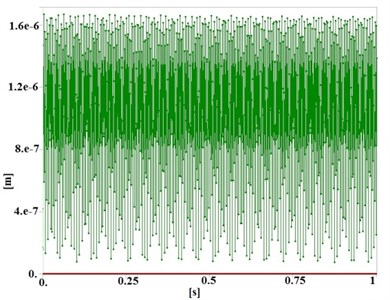
c) In 313.7 Hz
Table 4Corresponding spindle speeds with natural frequencies of moving table
Mode | Location | Natural frequency (Hz) | Spindle speed (rpm) with 2 | Spindle speed (rpm) with 4 |
1 | Highest | 178.2 | 5346 | 2673 |
Lowest | 193.5 | 5805 | 2902.5 | |
2 | Highest | 267.26 | 8017.8 | 4008.9 |
Lowest | 280.05 | 8401.5 | 4200.75 | |
3 | Highest | 298.66 | 8959.8 | 4479.9 |
Lowest | 313.71 | 9411.3 | 4705.65 | |
4 | Highest | 441.41 | 13242.3 | 6621.15 |
Lowest | 486.72 | 14601.6 | 7300.8 | |
5 | Highest | 480.92 | 14427.6 | 7213.8 |
Lowest | 492.11 | 14763.3 | 7381.65 | |
6 | Highest | 766.89 | 23006.7 | 11503.35 |
Lowest | 777.08 | 23312.4 | 11656.2 | |
7 | Highest | 898.63 | 26958.9 | 13479.45 |
Lowest | 913.33 | 27399.9 | 13699.95 |
For these assumptions, according to recommendation of Table 4, the spindle speed of 9411.3 (rpm) corresponding to natural frequency of 313.71 (Hz) should be avoided due to appearing the resonance phenomena. Therefore, to reveal this fact, the transient structural analysis of machining under following conditions is performed:
– The tool’s amplitude force in direction and in center of table is selected 100 N.
– Three sample spindle speeds are arranged to be 9000, 9750 and 9411.3 (rpm) corresponding to their resultant induced frequencies: 300, 325 and 313.17 (Hz) respectively.
The maximum total deformation of the transient structural analysis for these frequencies are illustrated in Fig. 8. According to these results, deformation of table, when is induced corresponding with its natural frequency (313.17 Hz) is about 4-5 times greater than the other conditions. Therefore, this analysis also verifies the results of Table 4.
8. Conclusions
In this paper, the vibration analysis of the vertical moving table of parallel machine tool was conducted. The provided CAD model of the table in Solid works was imported to the ANSYS environment and then, the natural frequencies and vibration mode shapes of the model were extracted. Then, using the FEM results, the exact natural frequencies and mode shapes of the table structure were obtained through experimental modal tests. The comparison between natural frequencies of FEM and experimental model shows the closeness of these results.
Moreover, the effect of table position on its natural frequencies was studied. This investigation shows that with increasing the height of the table, its natural frequencies decrease due to reducing its stiffness. To avoid resonance in the machining operation, the exciting frequencies of cutting operation should be far away from the natural frequencies of moving table. In this research, the machining conditions for the proposed parallel machine tool has been introduced, in which the operator can select spindle speeds, tool teeth, and table location in a manner that the exciting frequencies of machining operations be away from the natural frequencies of the structure. Finally, this prescription has been verified by transient structural analysis.
References
-
Maia N. M. M., Silva J. M. M. Theoretical and Experimental Modal Analysis. 1 Edition, Mechanical Engineering Research Studies, Wiley Press, 1997.
-
Mahboubkhah M., Nategh M. J., Esmaeilzadeh Khadem S. Vibration analysis of machine tools’ hexapod table. The International Journal of Advanced Manufacturing Technology, Vol. 38, 2008, p. 1236-1243.
-
Pakzad S., Rajab A. K. S., Mahboubkhah M., Ettefagh M. M., Masoudi O. Modal analysis of the surface grinding machine structure through FEM and experimental test. Advanced Material Research, Vol. 566, 2012, p. 353-356.
-
Pedrammehr S., Farrokhi H., Rajab A. K. S., Pakzad S., Mahboubkhah M., Ettefagh M. M. Modal analysis of the milling machine structure through FEM and experimental test. Advanced Material Research, Vol. 383, Issue 390, 2012, p. 6717-6721.
-
Yuan S. X., Wen X. L., Zhang Y. M. Modal analysis on the truss structures of machine tool. Advanced Material Research, Vols. 118-120, 2010, p. 972-976.
-
Patwari A. U., Faris W. F., Nurul Amin A. K. M., Loh S. K. Dynamic modal analysis of vertical machining centre components. Advances in Acoustics and Vibration, 2009, p. 508076.
-
Wu Z., Xu C., Zhang J., Yu D., Feng P. Modal and harmonic reponse analysis and evaluation of machine tools. International Conference on Digital Manufacturing and Automation, 2010, p. 929-933.
-
Herman A. P., Orifici A. C., Mouritz A. P. Vibration modal analysis of defects in composite T-stiffened panels. Composite Structures, Vol. 104, 2013, p. 34-42.
-
Zoury C. A., Allassy A. K., Ombes B. C., Oukarzel I. M., Oudet R. B. experimental and analytical modal analysis of a crankshaft. IOSR Journal of Engineering, Vol. 2, Issue 4, 2012, p. 674-684.
-
Cakir F., Uysal H. Experimental modal analysis of brick masonry arches strengthened prepreg composites. Journal of Cultural Heritage, Vol. 16, Issue 3, 2015, p. 284-292.
-
Jamróz T., Patočka K., Dániel V., Horáček T. Modal analysis of the rotor system. 20th SVSFEM ANSYS Users’ Group Meeting and Conference, 2012, p. 1-6.
-
Peeters M., Kerschen G., Golinval J. C., Stephan C., Lubrina P. Nonlinear modal analysis of aerospace structures. Thematic Conference on Computational Methods in Structural Dynamics and Earthquake Engineering, 2011, p. 26-28.
-
Pedrammehr S., Mahboubkhah M., Khani N. A study on vibration of Stewart platform-based machine tool table. International Journal of Advanced Manufacturing Technology, Vol. 65, 2013, p. 991-1007.
-
Pedrammehr S., Mahboubkhah M., Qazani M. R. C., Rahmani A., Pakzad S. Forced vibration analysis of milling machine’s hexapod table under machining forces. Journal of Mechanical Engineering, Vol. 60, 2014, p. 158-171.
-
Mahboubkhah M., Nategh M. J., Esmaeilzade Khadem, S. A comprehensive study on the free vibration of machine tools’ hexapod table. International Journal of Advanced Manufacturing Technology, Vol. 40, Issue 2009, 11, p. 1239-1251.
-
Chen Z., Ming L., Minxiu K., Chen J. Modal analysis of high-speed parallel manipulator with flexible links. Applied Mechanics and Materials, Vol. 826, 2016, p. 8-14.
-
Sahua S., Choudhury B. B., Biswal B. B. A vibration analysis of a 6 axis industrial robot using FEA. Materials Today, Vol. 4, 2017, p. 2403-2410.
-
Guo S., He Y., Shi Li., Pan S., Tang K., Xiao R., Guo P. Modal and fatigue analysis of critical components of an amphibious spherical robot. Microsystem Technologies, Vol. 23, Issue 6, 2017, p. 2233-2247.
Cited by
About this article

