Abstract
This pilot study gives evidence on the effect of low frequency 2-10 Hz vibration on young physically inactive subjects and associations with blood flow in limbs. For the study purposes, low frequency 2-10 Hz vibration was applied for the subjects in the lying position, and a special device, patented at Kaunas University of Technology, was used to generate low frequency vibrations. Altered temperatures in feet were measured with a thermovisual camera, which records thermal changes. Thermovisual measurement was performed in a warm room (20-21 °C). The entire procedure lasted 45 minutes. Thermovisual measurement was performed 15 minutes before vibration, 15 minutes during vibration and 15 minutes after vibration. For temperature analysis, 2 points on the subjects’ feet were chosen: the central point on the foot where the highest temperature was taken and the peripheral point on the foot where the lowest temperature was measured. Heart rate variability was measured by the Elite HRV programme. The data analysis of temperature in both the central and the peripheral points of the foot under low frequency 2-10 Hz vibration showed insignificant changes in temperature and blood flow; however, the differences determined were insignificant. The assessment of heart rate variability demonstrated that there were statistically significant differences before, during and after vibration. A tendency of the heart rate to increase shows that the heart also reacts to any changes when peripheral blood flow in feet is affected. A reverse dependence was determined: low temperature in the foot increases heart rate variability and, vice versa, increasing temperature decreases heart rate variability. It would be expedient and useful to conduct results with those of healthy subjects.
1. Introduction
Over the last decades the number and the variety of applications of vibrations in medical treatment did increase, however, robust evidence on significant effects (and especially the efficiency of the treatment) is still missing [1]. During the past decades, whole-body vibration has been studied in relation to static or dynamic exercise, but its effect on individuals in lying body position has not been analysed [2]. Research studies related to vibration are usually classified into studies on vibration caused in professional environment and studies on mobility enhancement and muscle activation [3]. In 1996, Nakamura was one of the first researchers to claim that vibration applied for research purposes provided different blood flow than vibration caused in the professional environment [4]. The conducted research showed that whole-body vibration influenced the blood flow in arteries [5]. However, such studies were meant to evaluate the influence of high frequency vibration on the human body, and only a few studies described low frequency vibration effects. In 1989, Chudacek studied the effect of 125 Hz vibration on the blood flow in arms in 43 healthy school-age children [6]. Temperature was measured using a thermovisual camera. Thermographic records were made before and immediately after vibration as well as 30 and 60 minutes after vibration. The maximum temperature change was observed after 60 minutes in 5 children. In another study, effects of whole-body vibration on the blood flow in legs were investigated in 9 healthy young men who had 14 random vibrations and exercises without applied vibration. Vibration frequency ranged between 5 and 30 Hz, every 5 intervals. Systolic and diastolic blood pressure was measured in the femoral artery. Doppler ultrasound was used to measure the blood cell rate. The data of the subjects during the vibration and simple exercises were compared. In the first case, under vibration frequency from 5 to 30 Hz, the blood cell rate increased by 33 % [7]. Gavriel Salvendy (2012) overviews and provides a few interesting facts about low frequency vibration [8]. Vertical 4 Hz whole-body vibration already makes a person pour out liquid out of a cup. Vibration which is 4-8 Hz causes writing difficulties. The author also states that both negative and positive effects of vibration on the human body may be already achieved at 5-20 Hz vibration. Other authors, who have investigated whole-body vibration effects on the blood flow in legs, claim that the body is more sensitive to 5 Hz vibration than to 50 Hz vibration [9].
Other studies report the influence of vibration on cardiac and circulatory systems. In one study, authors note that the amplitude of electromyography and the maximum blood velocity have increased and the frequency decreased, due to vibration [10]. Another study investigated the effect of whole-body vibration on the blood flow in legs when knee-bend exercises were applied. Two measurements were taken: when subjects performed knee-bend exercise and were affected by vibration and when vibration was not applied. Blood cell velocity at rest and blood pressure in the femoral artery were measured. The results showed increased blood flow under vibration; however, no significant difference was observed. Osawa et al. (2011) found that whole-body vibration had a positive effect on arterial blood flow and other parameters of the circulatory system [11]. In another study, blood velocity was observed under whole-body vibrations at 26 Hz frequency. The mean of blood flow velocity in the iliac artery had increased. Baum et al. (2007) conducted research with type 2 diabetes patients and proved that vibration could be an effective method to improve the glycaemic level control [12]. Another study was performed to determine the reaction of the heart and vessels to whole-body vibration. The study included healthy young subjects, subjects of older age, women with obesity and subjects with spinal cord defects. The study found evidence that whole body vibration increased oxygen uptake and the heart rate in young healthy adults during physical workload. The influence of vibration intensity on the activity of the heart and blood vessels during physical workload was also proven [13]. Recently vibration has been used for improving peripheral blood circulation [14]; however, there are no studies to investigate low frequency 2-10 Hz vibration. Therefore, the aim of this study was to determine the effects of low frequency 2-10 Hz vibration and associations with blood circulation in lower limbs. The objectives of the research were to investigate changes in temperature and blood circulation in feet, to assess the heart rate variability and associations between blood circulation in feet and heart rate variability under low frequency 2-10 Hz vibration.
2. Materials and methods
The study was conducted in 2016 at the Institute of Mechatronics of Kaunas University of Technology. Permission No. BEC-SR(M)-70 of the Bioethics Centre of the Lithuanian University of Health Sciences was obtained for research. Healthy subjects 15; mean age 20.1±1.2) who were not involved in any active sports. During the study, the subjects underwent low frequency 2-10 Hz vibration. The temperature changes in feet was measured with a thermovisual camera, which records heat changes. Heart rate variability was evaluated using the Elite Heart Rate Variability (Elite HRV) programme with an electrode placed on the body. All the participants provided their written informed consent prior to their inclusion into the study, in accordance with the ethical principles of the Declaration of Helsinki.
Vibration therapy. The device, designed by PhD Mantas Venslauskas at Kaunas University of Technology, generates by its beat 1-10 Hz frequencies and 1-50 mm displacement amplitudes, that establish sufficient force for needed displacement on limbs. In order to create the beating phenomenon and low frequency vibrations, electromechanical motors with unbalanced masses, that could be partially cylindrical, mounted on rotator axes were used. The motors are low rotation frequency electrical motors with the nominal value of 1,000 revolutions per minute. Unbalanced masses are mounted on the rotor. Their shape enables centrifugal forces to affect the rotors. According to the previous study, the range of 2-10 Hz frequencies influences blood flow the most. Lower than 2 Hz and higher than 10 Hz gives small or no influence. This range of frequencies was proved experimentally and numerically as the most effective for a better blood perfusion (Venslauskas et al., 2017).
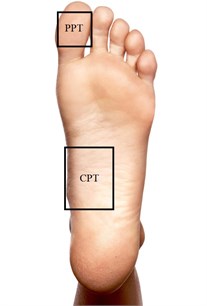
Thermal pictures. Infrared cameras provide pictures showing accurate temperature because of infrared rays and body heat [15]. In this study, we used an infrared camera FLIR SC7000, which is very precise, sensitive and fast, and gives an accurate spatial view. This camera has been designed specifically for scientific research. The camera has a few detectors that can be chosen according to the pictures required. The programme allows selecting and marking environmental temperature to avoid biased research data. The temperature measurements range between +5 °C and +300 °C. In this study, the room was heated to 20-21 °C before making thermal pictures. This temperature was chosen having analysed previous research studies where a thermovisual camera was used. The subjects with bare feet were lain on a vibration device. They were asked to lie calm for 15 minutes, and the temperature of the feet was recorded. After 15 minutes, vibration was applied, and the temperature changes in the feet were recorded during the entire vibration session. During the most important phase of the research – when vibration was ceased – temperature changes in the feet were recorded for another 15 minutes. Over the 45-minutes period, the data were recorded and we could see how the temperature in the subjects’ feet had changed. All the subjects claimed to have experienced tingling in the legs for 5 minutes after the procedure. Two points were chosen for temperature analysis: the central point (CPT) on the foot where the highest temperature was measured and the peripheral point (PPT) on the foot where the lowest temperature was measured (Fig. 1).
Fig. 1Measurement points: PPT – peripheral point, CPT – central point
Heart rate variability (HRV) is a non-invasive tool, which allows the exploration of cardiovascular autonomic function through the measurement of variations in RR intervals [18]. To evaluate heart rate variability, the programme Elite HRV was used. The programme analyses the data of an electrode placed on the body. It allows recording impulses of the heart over the whole investigation time and shows heart rate variability. In this study, heart rate variability was recorded during the whole investigation period, i.e. 15 minutes before vibration, 15 minutes during the vibration session, and 15 minutes following vibration. The subjects were asked not to speak, not to worry and lie calm in order to obtain accurate data of heart rate variability.
3. Statistical analysis
Statistical data analysis was performed using IBM SPSS Statistics 22 package. Comparison of quantitative variable values that did not satisfy normal distribution in two dependent groups was performed using the non-parametric Wilcoxon test. Comparison of quantitative variable values that did not satisfy normal distribution in three or more dependent groups was conducted using the non-parametric Friedman test. The results of non-parametric tests are given as the median of qualitative variables (maximum, minimum, and mean values) in compared sample sizes. The observed differences between variables were considered statistically significant if the calculated level of significance ( value) was lower than the chosen level of significance (0.05). To assess the dependence of quantitative variables that did not satisfy normal distribution, the Spearman correlation was chosen. If correlation coefficient 0, there was no relation; if 0 0.3, the correlation was very weak; if 0.3 0.5, the correlation was weak; if 0.5 0.7, the correlation was moderate; if 0.7 0.9, the correlation was strong; and if 0.9 1, the correlation was very strong.
4. Results
Analysis of temperature changes in the central point of the foot. The results of temperature changes (temperature in the central point of the foot immediately after vibration and after 5 minutes; temperature in the central point of the foot immediately after vibration and after 10 minutes; and temperature in the central point of the foot immediately after vibration and after 15 minutes) are presented in Fig. 2. The analysis of all the changes in the temperature did not show any statistically significant differences ( 0.662).
Fig. 2Comparison of temperature changes in the central points of the foot: A – 5 min, B – 10 min, C – 15 min after the vibration and immediately after vibration
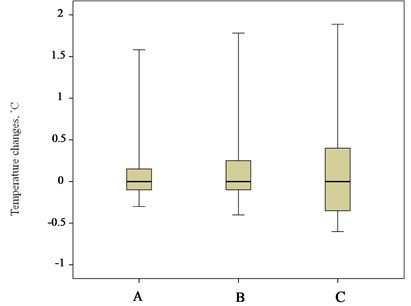
Fig. 3Comparison of temperature changes in peripheral points of the foot: A – 5 min, B – 10 min, C – 15 min after the vibration and immediately after vibration
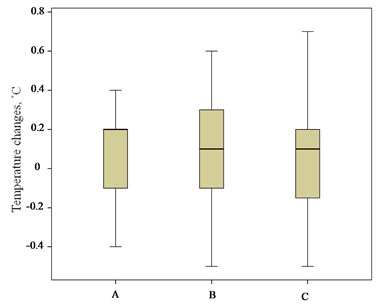
Analysis of temperature changes in the peripheral point of the foot. The results of temperature changes (temperature in the peripheral point of the foot immediately after vibration and after 5 minutes; temperature in the peripheral point of the foot immediately after vibration and after 10 minutes; and temperature in the peripheral point of the foot immediately after vibration and after 15 minutes) are presented in Fig. 3. The analysis of all the changes in the temperature did not show any statistically significant differences ( 0.869).
Analysis of heart rate variability evaluation. The comparison of distributions of heart variability before vibration 52 (39; 72; 51.87) and heart variability after vibration 55 (46; 70; 55.93) showed a statistically significant difference ( 0.01). The results are presented in Fig. 4.
Evaluation of functional relations between heart rate variability and temperature. The temperature in the peripheral point of the foot statistically significantly correlated ( 0.05) by moderate reverse dependence with the heart rate variability before vibration ( –0.544) and after vibration ( –0.546). Statistically significant correlations of moderate reverse dependence ( 0.05) were determined between the temperature in the peripheral point of the foot immediately after vibration, the variability before vibration ( –0.588) and the variability after vibration ( –0.521). There was a moderate reverse dependence correlation ( 0.05) between the temperature in the peripheral point of the foot 5 minutes after vibration and the heart rate variability before vibration ( –0.554) and after vibration ( –0.515). There were statistically significant reverse dependence correlations ( 0.05) between the temperature in the peripheral point of the foot 10 minutes after vibration, the variability before vibration ( –0.543) and the variability immediately after vibration ( –0.515). The temperature in the peripheral point of the foot 15 minutes after vibration showed a statistically significant correlation ( 0.05) of moderate reverse dependence with the heart rate variability before vibration ( –0.519). Functional correlations between temperatures and variability parameters are shown in Table 2.
Fig. 4Comparison of heart rate variability distributions before and after vibration. * – statistically significant difference in comparison of distributions
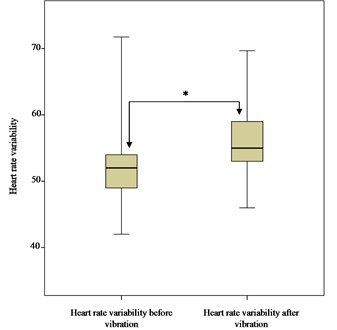
Table 2Functional relations between heart rate variability and temperature
Item | Heart rate variability before vibration (R-R) | Heart rate variability during vibration (R-R) | Heart rate variability after vibration (R-R) |
CPF t° C before vibration | 0.108 | 0.004 | –0.157 |
CPF t° C immediately after vibration | 0.075 | –0.044 | –0.206 |
CPF t° C 5 min after vibration | –0.06 | –0.106 | –0.253 |
CPF t° C 10 min after vibration | –0.02 | –0.145 | –0.261 |
CPF t° C 15 min after vibration | –0.041 | –0.170 | –0.311 |
PPF t° C before vibration | –0.544* | –0.494 | –0.546* |
PPF t° C immediately after vibration | –0.588* | –0.497 | –0.521* |
PPF t° C 5 min after vibration | –0.554* | –0.5 | –0.515* |
PPF t° C 10 min after vibration | –0.543* | –0.497 | –0.515* |
PPF t° C 15 min after vibration | –0.519* | –0.436 | –0.483 |
* 0.05; CPF – central point of the foot; PPF – peripheral point of the foot | |||
According to the data of the analysis, heart rate variability increased in case of low foot temperature and decreased in case of increasing temperature.
5. Discussion
Researchers have been interested in physiological responses of the human body to vibration. One of the greatest concerns of all has been possibility to improve peripheral blood circulation without pharmacological measures [16]. The analysis of temperature changes in the central and peripheral points on the foot during vibration did not yield statistically significant differences. Similar results have been obtained by other authors who have investigated the influence of vibration on the human body. The data of our study corresponded to those obtained by Hazell et al. in a study conducted in 2008, when the authors evaluated the influence of vibration on heart rate and blood flow in the femoral artery under static exercise [17]. In the study, no statistically significant changes were determined in any parameters measured. In a study conducted in 2007, Button et al. applied 60 Hz vibration for 30 minutes in order to determine the influence of vibration on blood circulation in arms [16]. This study revealed no statistically significant changes in blood circulation. In 2012, Robbins et al. gave explanations for such results, claiming that such outcomes were conditioned by a vasospastic reaction of blood vessels causing resistance to blood flow from capillaries [3]. Although this mechanism has not been completely investigated, it could explain our research results that temperature did not statistically significantly differ in the central and the peripheral point on the foot when peripheral blood circulation was examined in feet. In this study, 2 points on feet were chosen. In our opinion, they should have represented well the changes in temperature on the foot, as we could not find data on how to measure temperature in analysed research papers. It would be beneficial to use more points on the foot in future investigations, especially in different areas of the foot, thus obtaining more accurate results and perhaps even registering the smallest temperature changes, yielding statistically significant results. Having analysed all previous studies, we chose to apply vibration for 15 minutes, as this timing was described in the methodology of many papers. In future studies, it would be reasonable to prolong this period to 30 minutes and observe changes in the circulation longer than 15 minutes after vibration, as activated circulation and increase in temperature may occur later. The timing before vibration should also be modified. The chosen 15 minutes require special preparation of the room. Temperature should not drop below 20 °C, thus requiring heaters to be used. Our study could be repeated on individuals with peripheral blood circulation deficiencies, and comparison of the results with those obtained for healthy subjects could be beneficial and expedient. The conducted study demonstrated that there were statistically significant differences in the heart rate variability before vibration, during vibration and after it. The analysis of the functional relations between the heart rate variability and the changes in the temperature showed statistically significant differences only in the peripheral points on the feet. Statistically significant differences were found in all the phases of vibration. Reverse dependence was determined, i.e. in case of low temperature on the foot, the heart rate variability increased, and in case of increasing temperature, the variability decreased. This finding may be explained by the fact that adaptation of the cardiovascular system to thermal stimuli occurs due to simultaneous activation of efferent branches and peripheral vessels of the autonomic cardiac nervous system [18]. We have not been able to find studies comparing associations between heart rate variability and temperature changes of the human peripheral blood circulation, which might be the future research topic.
6. Conclusions
There are number of studies where the influence of whole body vibration is analyzed but on the other hand there is a lack of researches of local impact. Furthermore, this work distinguishes from the others that we have found statistically significant impact between the heart rate variability and the therapy of locally generated low-frequency (2-10 Hz) mechanical vibrations. Although the higher frequencies of 30-50 Hz were broadly analyzed on the previous studies, this work proves the positive effect of low-frequency vibration impact on cardiovascular system. In our research, we found slight changes in blood circulation and temperature were detected in the subjects’ feet when applying low frequency 2-10 Hz vibrations. Trends of changes in heart rate variability were detected when applying low frequency 2-10 Hz vibrations. Heart rate variability decreased with increasing temperature of the feet when applying low frequency 2-10 Hz vibrations.
References
-
Games K. E., Sefton J. M., Wilson A. E. Whole – body vibration and blood flow and muscle oxygenation: a meta – analysis. Journal of Athletic Training, Vol. 50, Issue 5, 2015, p. 542-549.
-
Rittwegger J. Vibration as an exercise modality: how it may work and what its potential might be. European Journal of Applied Physiology, Vol. 108, Issue 5, 2010, p. 877-904.
-
Robbins D., Elwell C., Jimenez A., Goss – Sampson M. Localised muscle tissue oxygenation during dynamic exercise with whole body vibration. Journal of Sports Science and Medicine, Vol. 11, Issue 2, 2012, p. 346-351.
-
Nakamura H., Okazawa T., Nagase H., Yoshida M., Ariizumi M., Okada A. Change in digital blood flow with simultaneous reduction in plasma endothelin induced by hand – arm vibration. International Archives of Occupational and Environmental Health, Vol. 68, Issue 2, 1996, p. 115-119.
-
Chudacek Z. Changes in the thomographic picture of hands of healthy persons after vibrations of 125 Hz. Cech Radio, Vol. 43, Issue 2, 1989, p. 98-101.
-
Lythgo N., Eser P., Groot P., Galea M. Whole-body vibration dosage alters leg blood flow. Clinical Physiology and Functional Imaging, Vol. 29, Issue 1, 2008, p. 53-59.
-
Salvendy G. Handbook of Human Factors and Ergonomics. Fourth Edition, John Wiley and Sons, New Jersey, 2012.
-
Mansfield N. J. Human Responce to Vibration. D.C. CRC Press, 2004.
-
Lohman E. B., Sackiriyas S. B., Bains G. S., Calandra G., Lobo C., Nakhro D., et al. A comparison of whole body vibration and moist heat on lower extremity skin temperature and skin blood flow in healthy older individuals. Medical Science Monitor, Vol. 18, Issue 7, 2012, p. 415-424.
-
Osawa Y., Oguma Y. Effects of whole body vibration on resistance training for untrained adults. Journal of Sports Science and Medicine, Vol. 10, Issue 2, 2001, p. 328-337.
-
Baum K., Votteler T., Schiab J. Efficiency of vibration exercise for glycemic control in type 2 diabetes patients. International Journal of Medical Sciences, Vol. 4, Issue 3, 2007, p. 159-163.
-
Liao L. R., Ng G. Y., Jones A. Y., Pang M. Y. Cardiovascular stress induced by whole-body vibration exercise in individuals with chronic stroke. Physical Therapy, Vol. 95, Issue 7, 2015, p. 966-977.
-
Lee K., Song C. Determining the posture and vibration frequency that maximize pelvic floor muscle activity during whole – body vibration. Medical Science Monitor, Vol. 27, Issue 22, 2016, p. 4030-4036.
-
Raith W., Litscher G., Sapetsching I., Bauchinger S., Zienenberger E., Muller W., et al. Thermographical measuring of the skin temperature using laser needle acupuncture in preterm neonates. Evidence-Based Complementary and Alternative Medicine, 2012|, https://doi.org/10.1155/2012/614210.
-
Button C., Anderson N., Bradford C., Cotter J. D., Ainslie P. N. The effect of multidirectional mechanical vibration on peripheral circulation of humans. Clinical Physiology and Functional Imaging, Vol. 27, Issue 4, 2007, p. 211-216.
-
Hazell T. J., Thomas G. W., Deguire J. R., Lemon P. W. Vertical whole – body vibration does not increase cardiovascular stress to static semi-squat exercise. European Journal of Applied Physiology, Vol. 104, Issue 5, 2008, p. 903-908.
-
Flouris A. D., Cheung S. S. Influence of thermal balance on cold - induced vasodilation. Journal of Applied Physiology, Vol. 106, Issue 4, 2009, p. 1264-1271.
-
Thayer J. F., Åhs F., Fredrikson M., Sollers J. J., Wager T. D. A meta-analysis of heart rate variability and neuroimaging studies: implications for heart rate variability as a marker of stress and health. Neuroscience and Biobehavioral Reviews. Vol. 36, Issue 2, 2012, p. 747-56.
About this article

This research was funded by a Grant (No. SEN-10/15) from the Research Council of Lithuania.
L.G., G.K. and M.V. conceived the original idea for the paper. L.G. and M.V. wrote and designed the draft of the manuscript and they were general leaders of the investigation. V.Š. performed statistical analysis. All the authors (L.G., G.K., V.Š., R.S. and M.V.) contributed to this study by making comments on the manuscript and were involved in the interpretation of findings. All the authors read and approved the final manuscript.
