Abstract
To reveal the effect of the volute basic circle diameter on the performance of low specific sewage pumps, three different volutes equipped with the same impeller were designed for a low specific speed sewage pump. The global characteristics were obtained from the experiments, which presented that the volute basic circle diameter affects pump performance obviously. Computational fluid dynamics (CFD) was adopted to analyze the flow in the pump, as well as the velocity and pressure fields. Acoustic software LMS Virtual.Lab was adopted to analyze the acoustic field characteristics of the different models. The particle image velocimetry (PIV) technology was adopted to verify the results obtained by CFD and the qualitative agreement of the velocity obtained by CFD numerical calculation and PIV measurement is very good. It shows that the volute basic circle diameter has a small influence on the velocity distribution in the impeller. However, it changes the flow in the volute significantly. As increases, the 2D streamline smoothens and the velocity distribution becomes uniform, whereas the pressure fluctuations and radial force of the impeller weaken. Furthermore, when the volute basic circle diameter increases to a certain extent, the pressure fluctuations almost have no change. The flow induced noise in volute A# is the largest, whereas it is the smallest in volute B#. There is an optimal volute basic circle diameter for a pump with ultra-thick blade not only to achieve the highest efficiency, but also to achieve excellent operating stability.
1. Introduction
Low specific speed sewage pumps are widely used in sewage treatment plants and hydro-engineering projects to transport fluid containing long fibers and solid particles [1]. However, some problems still exist in its application, such as overloading at high flow rates and clogging [2, 3]. Reducing the blade number and adopting an ultra-thick blade can improve the through capacity and avoid overloading effectively [4-6]. When adopting an ultra-thick blade, the wake areas and velocity gradient increase significantly, thereby strengthening the rotor-stator interaction of the rotating impeller and the station volute. Thus, the ordinary design method of volutes is not suitable for low specific speed sewage pump. The rotor-stator interaction between the impeller and volute is the main cause of the pressure fluctuations [7-9]. Moreover, the pressure fluctuations inside the pump generated by instable flow may induce vibration and noise, which impact the environment and harm the stability of device operation [10-12]. Dong, Chu, and Katz [13-15] stated that the rotor-stator interaction between the impeller and the volute tongue is the major cause of the pump vibration. When the volute basic circle diameter increases to 1.2, the pump vibration is significantly weakened. The action of the blade wake makes the tongue oscillate, and pressure fluctuations and noise reach the maximum when the blade wake is close to the tongue. However, further increase of affects the performance adversely [16, 17]. Benra [18, 19] used CFD numerical calculations and experiments to study non-clogging centrifugal pumps, and found that changing the position of the tongue affects on the internal flow field and the pump vibration.
Therefore, the volute basic circle diameter has a great influence on pump performance, and it is also an important factor for the through capacity [20]. To analyze the influence of on the unsteady flow and pressure fluctuations of low specific speed sewage pump, three different volutes (A# / 1.013, B# / 1.130, C# / 1.195) equipped with the same impeller were designed. CFD and particle image velocimetry (PIV) technology were adopted to analyze the flow in the low specific speed sewage pump. The pump performance was obtained by experiment. The velocity and pressure fluctuations were calculated using transient, three-dimensional and viscous numerical simulations, and the numerical velocity distribution was compared with the results using the PIV technology. The pressure fluctuation frequency was obtained using fast Fourier transform (FFT) and the radial force was derived by numerical simulation. The pressure fluctuations in the surface of the volute and the impeller were used as the dipole sound source, and the acoustic field characteristics of the different models were analyzed by the acoustic software LMS Virtual.Lab.
2. Geometric parameters
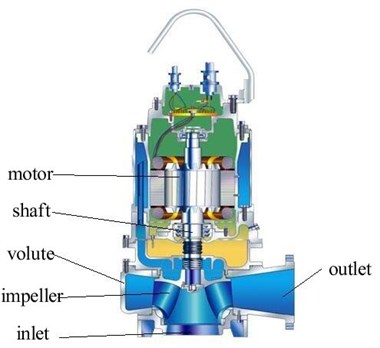
In this study, the sewage pump was a single-stage volute pump with a specific speed of 60 at design condition. The main design parameters were: 17 m3/h; 11 m; and the rotational speed was 1450 r/min. The structure diagram is shown in Fig. 1.
Fig. 1The structure of the sewage pump
The pump was designed using the increased flow rate method and the impeller adopted an ultra-thick blade, in which outlet area was smaller than the inlet area. Three different volutes were designed to match the impeller. The volute area and other parameters were the same; however, the basic circle diameter was different. In general, the reference value of / is equal to 1.03-1.08 [21]. However, the ordinary design method of the volute is not suitable for low specific speed sewage pump. Thus, three values of / were selected: volute A# is equal to 1.013, which is less than the reference value, and volutes B# and C# are 1.130 and 1.195, which are larger than the reference value. The main geometric parameters of the pump are presented in Table 1.
Table 1The main parameters of the pump
Description | Parameter | Value |
Diameter (mm) | 185 | |
Blade number | 3 | |
Blade outlet width (mm) | 20 | |
Blade wrap angle (°) | 225 | |
Blade inlet angle (°) | 14 | |
Blade outlet angle (°) | 14 | |
Volute A# | 187 | |
Volute B# | 209 | |
Volute C# | 221 |
3. Numerical methods
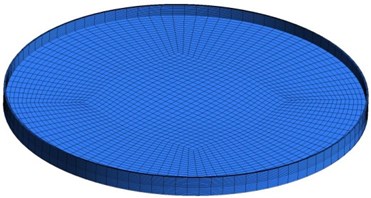
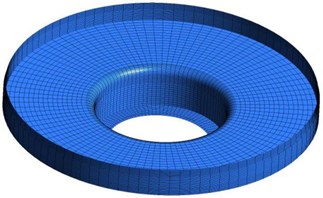
The calculation domains of the pump were generated using Pro/E. The front and back chambers were generated considering the leakage flows and disc friction between the impeller and casing walls. To obtain a relatively stable inlet and outlet flows, four times of the size of the pipe diameter was added to the real machine geometry [22, 23]. Calculation domains included: half-spiral suction, impeller, volute, front and back chambers, pipe intake and outlet duct. The computational domains are shown in Fig. 2.
Fig. 2The computational domains
Hexahedral structure meshing was adopted in this study. After utilizing 3/4 O-Block stretching and merging, the volute conducted the overall O-Block grid operation. Combined with the Y-Block, the spiral suction adopted a segmentation and conducted the overall O-Block grid operation after using whole Block. Only the mesh of a single flow passage of impeller was plotted and then processed periodically. The effect of the wall boundary layer was obtained by controlling the node distribution on the edge. The meshes of the front and back chambers were obtained by operating O-block grid after the ordinary split. The grid size dependence was studied based on the head at the design condition [24]. It showed that the head tends to be stable as the grid number increased. A final grid of approximately 1.070.000 nodes was used in this study, with the average wall Y+ below 100 in the entire computational regions. Grids of main computational domains are shown in Fig. 3.
The three-dimensional Reynolds-averaged N-S equations and the continuity equation were solved using the CFD code ANSYS CFX. The finite volume method was used to discretize the governing equations. The pressure and velocity coupling were calculated by the SIMPLEC algorithm. The high resolution scheme was used for the convection terms and the unsteady second-order implicit time integration scheme was used for the transient term [25]. Water at 25 °C was selected as the working fluid. The boundary conditions utilized for the simulation are presented in Table 2. The calculation used no-slip boundary conditions at all solid walls, and scalable wall functions at near wall region [26]. The total pressure and flow direction were imposed at the inlet, the turbulence parameters at the inlet were set to 5 % turbulence intensity, and the mass flow rate was given at the outlet [27]. Numerical calculations were done using a multiple frame of reference approach, whereas the impeller flow field was solved in a rotating frame and the other domains in a fixed frame. The global characteristics of the pump were calculated using the steady state simulation. Thus, the obtained solutions served as initial conditions for the unsteady calculations. For the steady state simulation, the interface between two stationary components was set to a general grid interface, whereas the interface between the rotational and stationary components was set to a frozen rotor interface. For the unsteady state simulation, the interfaces were set to the transient rotor-stator interface and the unsteady simulations used a time step of 3.447×10⁻⁴s (3° per time step) for the calculation of revolutions. The convergence accuracy was set to 10-4 [28].
Fig. 3Grids of main computational domains
a) Impeller grid
b) Spiral suction chamber grid
c) Volute B# grid
d) Back chamber
e) Front chamber
4. Experiment setup
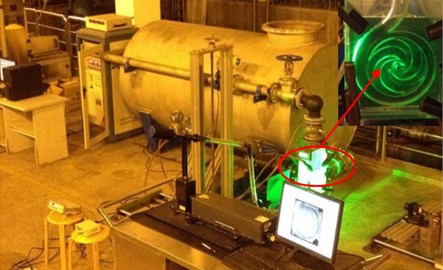
Experiments included a global characteristics test and PIV measurement. The experimental setup is shown in Fig. 4. The experimental device consisted of a tank, test pump, connecting pipes, valves, electromagnetic flowmeter, and other components. The flow rate was adjusted through a flow valve located downstream the pump outlet; the magnitude was measured with an electromagnetic flowmeter located in a straight pipe which was 20 times of the pipe diameter. The head was measured using two pressure transducers located at the pump inlet and outlet; the power was measured using a three-phase PWM digital power meter installed in the variable frequency control cabinet that can adjust the motor speed. All experimental data were managed and analyzed using the data acquisition instrument which was developed by Jiangsu University. The locations of the valve, electromagnetic flowmeter and pressure transducers in the system were designed in accordance with GB/T3216.The application of an uncertainty analysis gave an uncertainty of about ±0.6 % in the flow rate, ±0.5 % in head, and ±0.7 % in efficiency.
Table 2Boundary conditions
Boundary conditions | |
Inlet | Total pressure |
Outlet | Mass flow rate |
Turbulence | Standard - turbulence |
Walls | Smooth wall and scalable wall function |
Interface | General grid interface (GGI) Frozen rotor interface (steady analysis) Transient rotor-stator interface (transient analysis) |
Fig. 4Schematic diagram of the experiment setup: 1. Test pump export; 2. Water tank; 3. Support; 4. Line; 5. Electromagnetic flowmeter; 6. The manhole; 7. Vacuum pump interface; 8. Outlet valve; 9. The test pump; 10. Drain; 11. The saddle; 12. The test pump imported; 13. Import valve
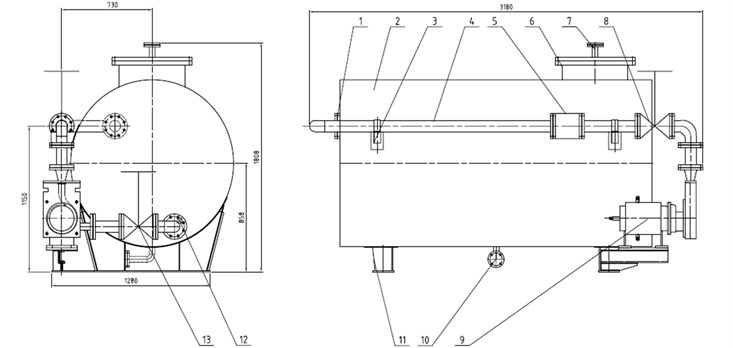
Fig. 5Schematic diagram of the model pump
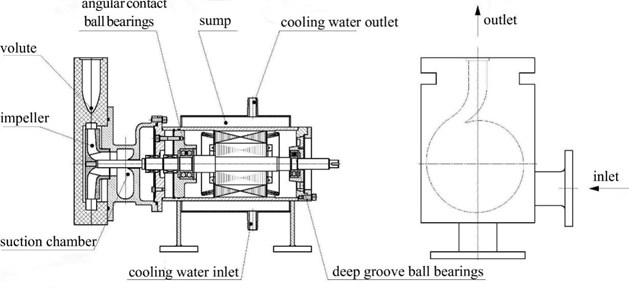
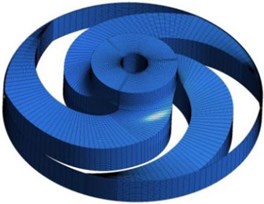
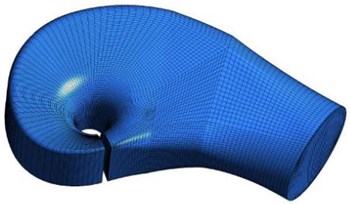
Fig. 6Impeller and volute for PIV measurement
a) Impeller
b) Volute
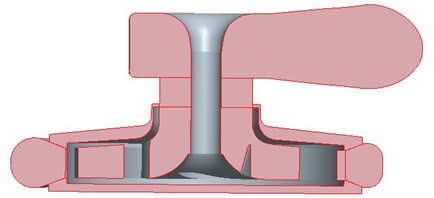
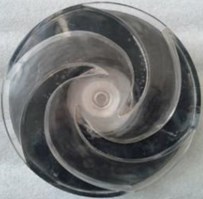
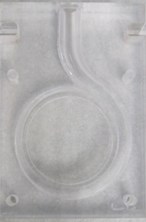
The model pump is shown in Fig. 5. The impeller and volute were made of organic glass. The motor was a fully sealed submersible motor, and the motor and pump were coaxial. Considering the laser projection direction and the camera position, the impeller inlet was directed toward the motor (ordinary pump inlet was behind the motor generally). Thus, a semi-spiral suction chamber was designed between the pump and the motor. The entry direction of the water in the pump was changed on the motor side. The PIV system adopted in this experiment is the TSI model which mainly includes New Wave YAG200NWL pulse laser, a 610.059 power view plus 4 M PIV camera, an Insight 3 G, a 610.015 light arm, and a light source lens [29]. Al2O3 powders were selected as tracer particles in the test, and the trigger synchronization system was used to lock blade the phase of the impeller [29]. A calibration water tank consisted of a water tank, and baffle was used to calibrate the test pump [29]. The middle span of the impeller and volute was used as the test plane. The images of the impeller are shown in Fig. 6. The PIV test process is shown in Fig. 7.
Fig. 7PIV test process
5. Results and discussion
5.1. Global performance characteristics
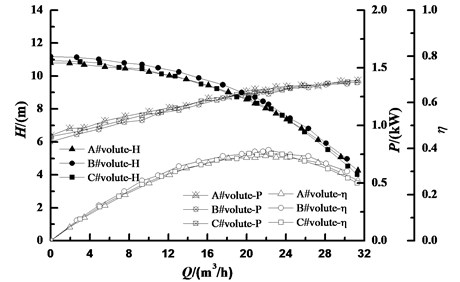
By changing the mass flow rate, the performance curves of the pump were obtained. The experimental data were acquired after stabilizing one minute of each valve adjustment. Global performance characteristics tests of each volute combination were conducted three times. The experimental results are presented in Fig. 8. As can be seen, apparently affected the pump performance, the combination of volute B# had the highest head and efficiency, whereas, volute A# had a lower head and the lowest efficiency. The best value existed for the low specific speed sewage pump. Moreover, the slope of the power curve was almost the same trends. Therefore, changing the basic circle diameter had no great impact on non-overload characteristics.
Fig. 8Performance curve of the pump
5.2. Flow in the impeller and volute
To reveal the influence of the volute basic circle diameter on the pump performance, CFD method was adopted to analyze the internal flow characteristics of the pump. Fig. 9 shows the relative velocity contour and 2D streamline distribution in the impeller at design condition, it can be seen that has a small influence on the internal flow of the impeller. The three cases all showed high relative velocity on the blade suction surface near the impeller inlet and low relative velocity on the middle of pressure surface. In the blade outlet, the relative velocity of the pressure surface was larger than the suction surface, forming a wake-jet phenomenon.
Fig. 9Relative velocity contours and 2D streamlines in the impeller at design condition
a) A#
b) B#
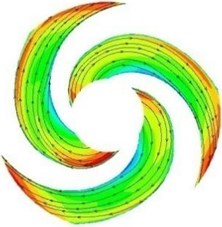
c) C#
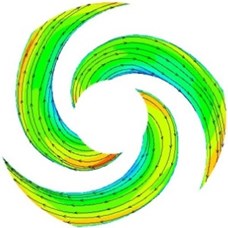
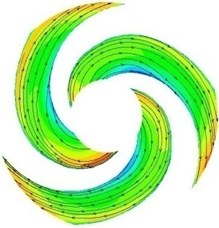
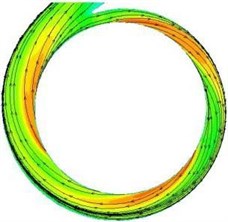
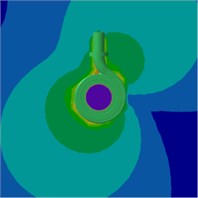
Fig. 10 shows the velocity contour and 2D streamline in the volute at design condition (include the gap between the impeller and volute). The flow in the small basic circle volute A# is unevenly distributed, and the velocity is high between sections I and III. As the smallest gap, the fluid cannot completely diffuse and collide with the volute wall directly, which resulted in large loss; Moreover, due to the blade presence between sections III and section IV of the volute, there is no fluid flow from impeller directly, and the fluid mainly flowed from section III, resulting in a lower velocity. Furthermore, the radial height of each volute section was small, therefore, the fluid flowing into section VIII could not be completely mixed and diffused, and would cause fluid bias on the outer wall in the diffuser of the volute and a low velocity area. As the gap between impeller and volute increased, the flow improved significantly. However, three high velocity regions exited that were caused by the wake-jet in the impeller.
Fig. 10The contours and 2D streamline distributions in the volute at design condition
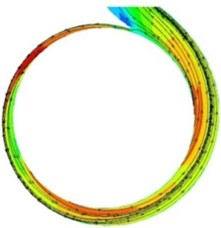
a) A#
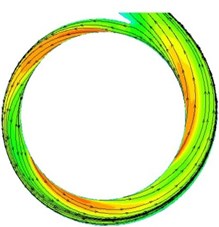
b) B#
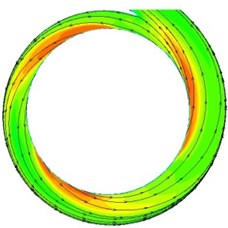
c) C#
5.3. Validation of numerical calculation
In order to verify the results obtained by numerical simulation, PIV technology was adopted in this study. The experimental velocity of the pump with the medium basic circle volute B# was compared with the numerical, Fig. 11 shows the velocity of the impeller and volute at design condition. As can be seen, the measured velocity at the impeller outlet is larger than calculated, and the calculated high velocity regions are more apparent than what PIV measured. The difference between numerical computation and PIV measurement in paper [30-32] also can be found, it is regarded as acceptable in numerical simulation of centrifugal pumps. The reason may be the existence of some tracer particles that gathered at the impeller outlet and vortex structure of the numerical simulation having differences within the real pump.
Fig. 11Measured and calculated velocities at design condition (mid-span of the pump)
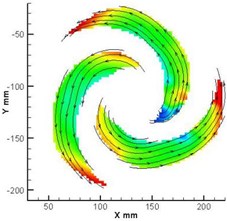
a) PIV of impeller
b) Simulation of impeller
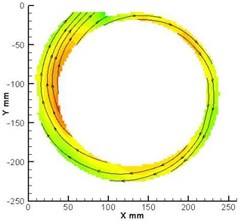
c) PIV of volute B#
d) Simulation of volute B#
5.4. Pressure fluctuations
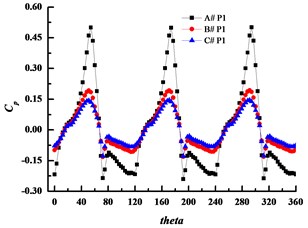
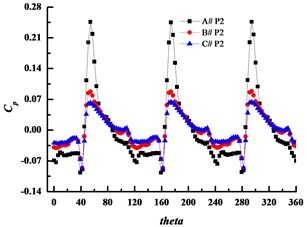
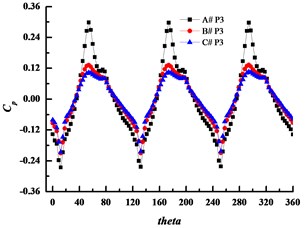
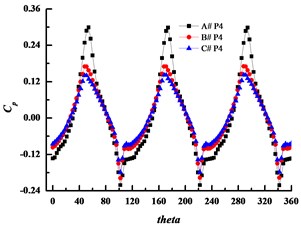
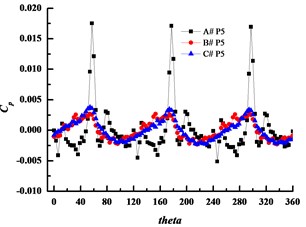
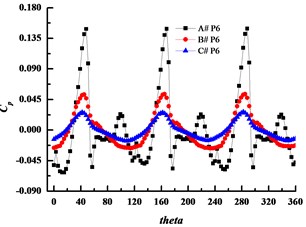
Numerical simulation was adopted to analyze the pressure fluctuations in this study. Six monitoring points were set at the simulation, and the position of monitoring points are shown in Fig. 12. Fig. 13 illustrates the time history of pressure fluctuations for the monitoring points at design condition. In the figure, three large peaks and valleys in a circle in the volutes can be seen. The highest pressure takes place just before the pressure surface of blade reaches the volute tongue, and the valleys occurs after the suction surface of blade passes through the volute tongue, and causes the wake impinging on the volute tongue. The amplitude of pressure fluctuation is the largest when applying the small basic circle volute, A# at any point.
Fig. 12Diagram of the monitoring points
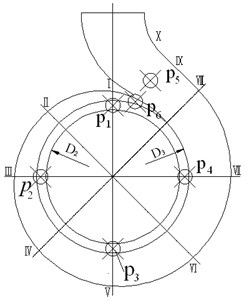
Fig. 13Time history of pressure fluctuations for monitoring points at design condition
a) P1
b) P2
c) P3
d) P4
e) P5
f) P6
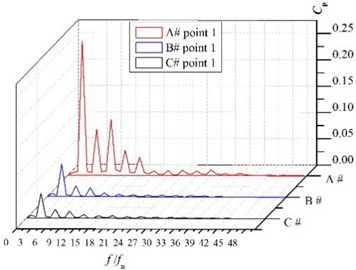
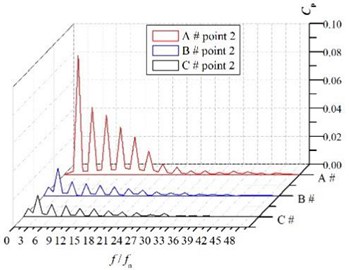
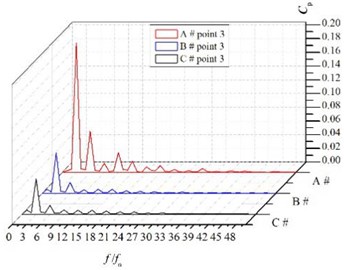
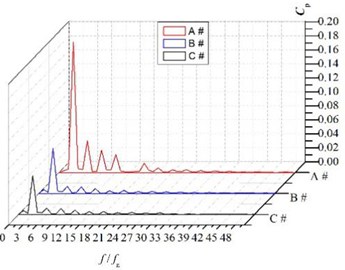
The pressure fluctuations frequencies were obtained by FFT. Fig. 14 presents spectra of the pressure fluctuations at the volutes. The pressure fluctuations are shown to exhibit the large amplitude at the blade-passing frequency, which is equal to 3 times of the rotational frequency and its harmonics. Moreover, the largest amplitude is presented at the blade-passing frequency, therefore the dominant frequency at volute is the blade-passing frequency. The pressure fluctuation amplitude of the dominant frequency at monitoring points is shown in Table 3.
The pressure fluctuation amplitude at point1 is larger than the other points, while it decreases significantly at point 5 which is at the diffuser part of the volute. As increasing the volute basic diameter can weaken the rotor-stator interaction effectively, the amplitude decreases with the increasing of the volute basic diameter obviously, and the amplitude of volute A# is several times larger than those of volute B# and volute C#. So, it can conclude that increasing can inhibit pressure fluctuations effectively and the main reason for the pressure fluctuations is the rotor-stator interaction.
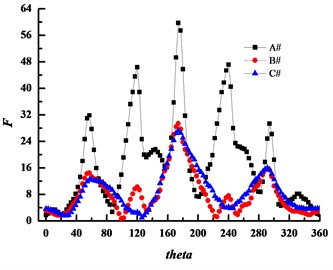
The unsteady flow and pressure fluctuations in the pump will inevitably lead to a radial force of the impeller. Fig. 15 shows the radial force of the impeller with different volute basic circle values. As seen from the figure, the radial force of the impeller with the small basic circle volute A# is significantly larger than the other two volutes. The medium basic circle volute B# is basically consistent with the large base circle volute C#; In addition, the radial force appears maximum value when impeller turns over 180°.
Fig. 14Spectra of the numerical pressure fluctuations
a) P1
b) P2
c) P3
d) P4
Table 3Amplitude of dominant frequency at monitoring points
Amplitude () | A# | B# | C# |
Point 1 | 0.25427 | 0.06164 | 0.04736 |
Point 2 | 0.08474 | 0.01962 | 0.01552 |
Point 3 | 0.18884 | 0.05946 | 0.05158 |
Point 4 | 0.18638 | 0.0643 | 0.05553 |
Point 5 | 0.00274 | 0.00192 | 0.00159 |
Point 6 | 0.03656 | 0.01468 | 0.00738 |
Fig. 15The radial force of impeller
5.5. Flow induced noise
The pressure fluctuations in the surface of the volute and the impeller were used as the dipole sound source [33, 34], and the acoustic field characteristics of the different models were analyzed by the acoustic software LMS Virtual.Lab. Automatic matched layer (AML) in LMS Virtual.Lab was used to automatically capture and match the noise boundary of pump. When using the acoustic boundary element method to calculate the internal noise of the pump, it is not necessary to consider the interaction between the structure and the fluid. Only the surface mesh of the model pump needs to be extracted to solve the response. The required surface wall dipole sound source which includes the impeller surface and the volute surface was extracted from the transient flow field calculation results. The surface pressure fluctuations obtained by CFD were interpolated to the boundary element of the acoustic model and it was set as the acoustic boundary. The inlet and outlet of the pump were defined as sound absorption properties, the acoustic impedance was 1.5×10⁶ kgm-2s-1, and the remaining fluid surface set as the total reflection wall, where the sound velocity in water is 1483 m/s, the reference sound pressure is 1×10⁻⁶Pa. The acoustic boundary grid has a great influence on the accuracy of pump noise simulation, in general, it requires < /6, where is the maximum length of the grid unit, is the largest calculation frequency, c is the sound speed. In this paper, 1483 m/s, the maximum frequency of flow noise is about 1470 Hz, and should be less than 0.170 m. ICEM was adopted to mesh the boundary grid of the model pump, and the maximum grid length is 0.004 m in this calculation which satisfies the requirement of boundary grid quality.
Sound pressure level SPL was used to indicate the level of noise, which is described as follows:
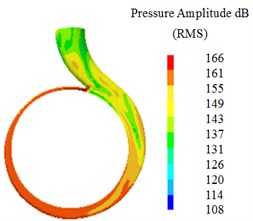
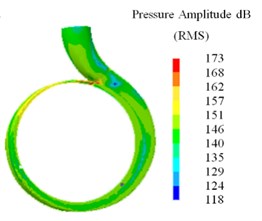
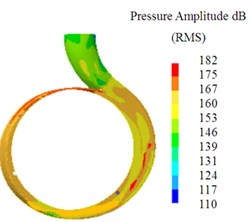
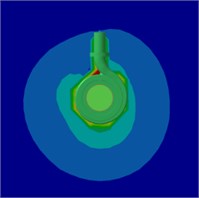
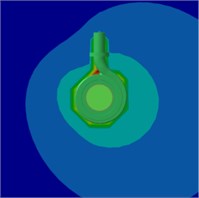
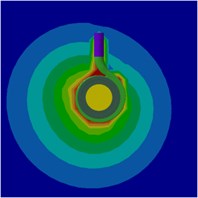
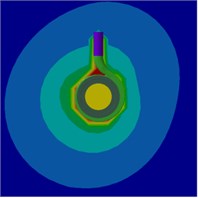
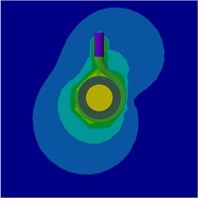
where is refence sound pressure, 10-6 Pa in water, 0.25 Hz. Fig. 16 shows the sound pressure level contours of the three volutes at the design condition, it can be seen from the figure, SPL of the volute B# is the smallest, whereas SPL of the volute A# is the largest. SPL near the tongue is significantly higher than other places, and SPL distribution in the volute B# is more uniform than others. SPL range is mainly between 140 dB and 150 dB in volute B#. Compared with Fig. 10, as the smallest basic circle, the fluid cannot completely diffuse and collide with the volute wall directly, it results in SPL of the volute A # is the largest.
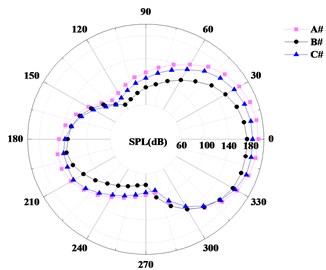
In order to observe the characteristics of the dipole sound source more intuitively, 36 noise monitoring points were arranged on the volute basic volute, Fig. 17 presents the noise monitoring points. Fig. 18 shows the directivity of the dipole sound source at design condition. All of the volute dipole sound source is presented with 8-shaped directivity, and the peak of the sound pressure level is presented near the tongue. The circumferential noise of the volute B# is smaller than the others. Fig. 19 presents the sound pressure level of the inlet and outlet monitoring point under different flow rate.
Fig. 16The sound pressure level counters of the three volutes at the design condition
a) A#
b) B#
c) C#
It can be seen from the figure that the sound pressure level of the pump inlet and outlet is similar, and the sound pressure level of the pump outlet is obviously higher than that of pump inlet, which indicates that the flow noise of the pump is propagating to the exit of the volute along with the rotation of the impeller. The noise of the inlet and outlet in the pump with volute A # is the largest, whereas that in the pump with volute B # is the smallest. It can be concluded that, the volute basic circle has a significant effect on the sound pressure level distribution of the volute source, and there is an optimal volute basic circle which the sound pressure level is the smallest.
Fig. 17Noise monitoring points
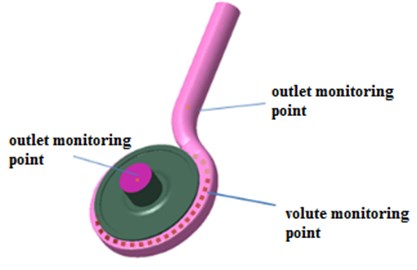
Fig. 18The directivity of the dipole sound source at design condition
Before the external sound field was solved, the modal calculation of the pump structure was carried out using the acoustic finite element module in LMS Virtual.Lab and then the structural response and the internal acoustic field were coupling solved. The pump equipped with the volute B# was regarded as the study subject. The shape of the prototype pump is relatively complex obtained by casting, the pump material is isotropic, elastic modulus 135 GPa, density 7000 kg/m3, Poisson’s ratio 0.3. Considering the influence of the grid number on the calculation accuracy and calculation amount, the acoustic grid coupling with the grid density of 5 mm was selected based on the natural frequency of the modal response results. Three displacement constraints were applied to the bottom surface in contact with the foundation and the surface to which the motor was connected, respectively. The inlet and outlet of the pump were defined as the sound absorption properties of the board, the flow surface was defined as the acoustic and vibration coupling boundary, and the other walls were defined as the total reflection wall. The external acoustic field was air in which acoustic impedance is 416.5 kg.m-2.s-1 and the velocity of sound is 340 m/s. The geometric difference method was used to map the internal acoustic field grid and the pump structure grid. To facilitate the observation of the distribution of the radiation sound, a square plane with a length of 1 m is created on the plane perpendicular to the impeller inlet and at the mid-span of the volute. It is shown in Fig. 20.
Fig. 19Sound pressure level variation at inlet and outlet under different flow rate
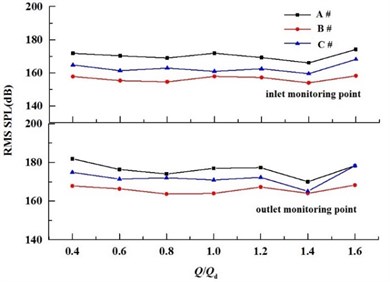
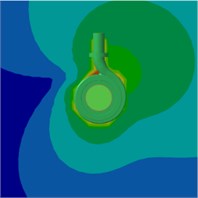
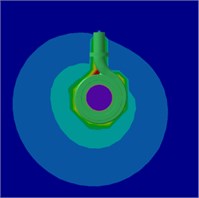
Fig. 21, Fig. 22 and Fig. 23 show the radiation sound SPL counters on the mid-span of the pump at 0.6, 1.0 and 1.4, respectively. It can be seen from the figures that the radiation sound SPL counters are similar at the different flow rates and the sound pressure level at the inner surface of the pump is the highest which is the position of the radiation source. Meanwhile, the farther away from the pump, the sound pressure level is significantly reduced. The pump sound pressure level near the volute was significantly higher at blade passing frequency(BPF) than its harmonic frequency, and it decreases with the increasing frequency. The distribution of the sound field is relatively uniform at the blade passing frequency(BPF).
Fig. 20The surface mesh
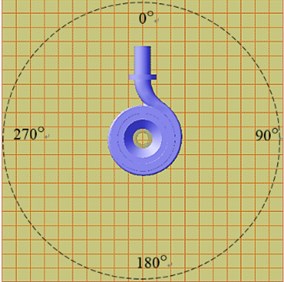
Fig. 21Radiation sound SPL counters on the mid-span of the pump at 0.6Qd
a) BPF
b) 2BPF
c) 3BPF
Fig. 22Radiation sound SPL counters on the mid-span of the pump at 1.0Qd
a) BPF
b) 2BPF
c) 3BPF
Fig. 23Radiation sound SPL counters on the mid-span of the pump at 1.4Qd
a) BPF
b) 2BPF
c) 3BPF
5.6. Velocity distribution
To further reveal the internal flow characteristics and the cause of pressure fluctuations and flow noise of the different volutes, the following parameters were induced: where is the angle of the circumferential direction of the chosen point; the -axis positive coordinate is defined as 0° and increases in the counterclockwise direction; is the minimum circumferential angle of the chosen line; is the maximum circumferential angle of the selected line; is the velocity, which is the velocity of the impeller. is the average velocity of all points in the selected line:
Therefore, represents the ratio of the location at any point on the line; represents the ratio of the velocity to the average velocity at any point; is defined as the abscissa; and is defined as the ordinate, which reflects the extent of velocity variation.
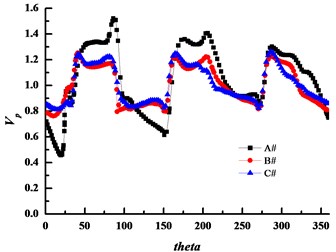
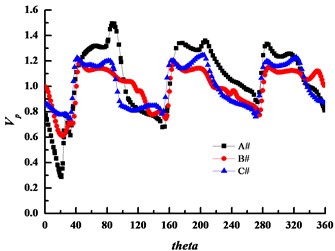
Fig. 24 shows the absolute velocity circumferential distribution near the impeller outlet at different flow rates. It can be seen that the velocity gradient is the largest in the small basic circle volute A#, while velocity in volutes B# and C# are close at any condition. Moreover, the velocity distribution is not uniform, three peaks and valleys exist in all volutes that are consistent with the blade and are caused by the jet- wake in the impeller. Furthermore, the velocity near the tongue (the circumferential angle of 20°) is minimum especially at the high flow rate, because flow collision and flow separation are serious near the tongue which results in high flow indused noise in the volute tongue. The degree of unevenness of the absolute velocity near the impeller outlet weakens with the basic circle increasing.
Fig. 24The absolute velocity circumferential distribution near the impeller outlet
a) Low flow rate
b) Design flow rate
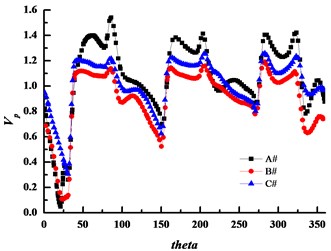
c) High flow rate
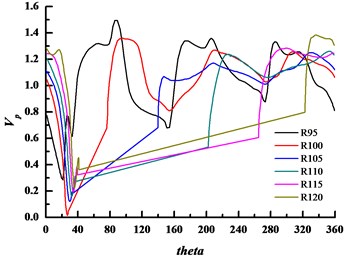
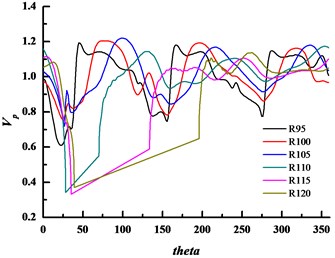
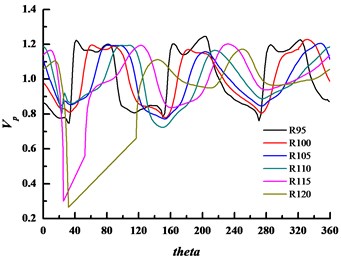
In order to better explain the influence of basic circle diameter on fluid mixing and diffusion in the volute, the velocities at different radii of the volute were extracted. The impeller diameter was 185 mm and we selected six splines, radii of which are 95, 100, 105, 110, 115 and 120 mm respectively. The velocity distribution is illustrated in Fig. 25.
Fig. 25The velocity coefficient distribution of three forms volute at different radii at design condition
a) Volute A#
b) Volute B#
c) Volute C#
When there is some line fall outside the volute domain, the velocity coefficient curve is directly connected by straight line of two boundary points. As seen from the figure, three peaks and valleys exist, and the difference between peak and valley is maximum in volute A#. Moreover, a small bump near the peak on the spline radius of 95 mm are seen, which is influenced by the blade outlet boundary layer. This phenomenon gradually disappears with increasing radius. As seen from Fig. 25(c), in the large basic circle volute C#, the difference of velocity distribution of different radius is less than the others. Therefore, it is concluded that the fluid flowing out from the impeller could be freely mixed and diffused in volute C#, and the velocity gradient is less than the others. In the small basic circle volute, A#, the velocity distributions of different radii is non-uniform, particularly between 280° to 360°. The angle where the peak appears has no apparent connection with radius, and the shape of the peak changes with angle changing. The condition of basic circle volute B# is between the two cases. It can be concluded that the more chaotic the flow, the greater the pressure fluctuations and flow induced noise. The flow impact is strong in the small basic circle volute A # and volute tongue, it induces the generation and shedding of vortex which enhanced the pressure fluctuations and flow induced noise.
6. Conclusions
In this study, a low specific speed sewage pump with an ultra-thick blade impeller was equipped with three different basic circle diameter values. The pump performance test rig was built and global performance characteristics were obtained. It indicates that volute basic circle diameter affects the pump efficiency and head obviously, whereas it has no great impact on non-overload characteristics. PIV technology was adopted to verify the results obtained by numerical simulation. The agreement of the velocity obtained by numerical simulation and by PIV measurement is very good, which illustrates that the CFD method has acceptable accuracy. CFD method was used to analyze the effect of the volute basic circle diameter on internal flow characteristics of the pump. Moreover, the velocity and pressure fields were obtained. The velocity in impeller with different showed that the volute basic diameter has a small influence on the impeller internal flow, on the other hand, changes the flow in the volute significantly, as the increases, the 2D streamline becomes smooth and the velocity distribution becomes uniform. Absolute velocity circumferential distribution was obtained by extracting the velocity at different radius, which illustrates that the velocity gradient in the small volute is the maximun. Three peaks and valleys were found in all volutes which is caused by the jet- wake in the impeller. The pressure fluctuations analysis showed that the pressure fluctuations and radial force decrease as increases. Furthermore, when the basic circle diameter of the volute is increased to a certain extent, the flow in the pump does not improve significantly. Acoustic software LMS Virtual.Lab was adopted to analyze the acoustic field characteristics of the different models. It shows that the flow induced noise in volute A# is the largest, whereas it is the smallest in volute B#. The pump which was equipped with the volute B# was used to analyse the external sound field, and it shows that radiation sound near the design conditions is the smallest. Thus, it suggests that there is an optimal volute basic circle diameter for a pump with the ultra-thick blade not only to achieve the highest efficiency, but also to achieve excellent operating stability.
References
-
Benra F.-K., Dohmen H. J., Schneider O. Calculation on hydrodynamic forces and flow induced vibrations of centrifugal sewage water pumps. Proceedings of FEDSM2003, Hawaii, USA, 2003.
-
Wei L., Shi W., Jiang X., et al. Analysis on internal solid-liquid two-phase flow in the impellers of sewage pump. Procedia Engineering, Vol. 31, Issue 16, 2012, p. 170-175.
-
Weidong Shi, Cao Weidong, Liu Houlin Design and experiment on a non-overload submersible sewage pump. Transactions of The Chinese Society of Agricultural Machinery, Vol. 34, Issue 1, 2003, p. 54-56.
-
Zhang D., Shi W., Chen B., et al. Experiment and impeller and volute matching optimization of high-head submersible sewage pump. Transactions of the Chinese Society of Agricultural Engineering, Vol. 29, Issue 1, 2013, p. 78-85.
-
Chen B., Zhang Hua, Shi Weidong Numerical calculation and experiment of non-overload low specific speed sewage pump with super-thick blades. Transactions of the Chinese Society for Agricultural Machinery, Vol. 43, Issue 5, 2012, p. 74-78.
-
Zhang H., Chen B., Shi W., et al. Effects of contraction-type impeller on non-overloaded performance for low-specific-speed sewage pump. Journal of Mechanical Science and Technology, Vol. 28, Issue 3, 2014, p. 937-944.
-
Kaupert K. A., Staubli T. The unsteady pressure field in a high specific speed centrifugal pump impeller – part I: influence of the volute. Journal of Fluids Engineering, Vol. 121, Issue 3, 1999, p. 621-626.
-
José González, Joaquín Fernández, Eduardo Blanco, et al. Numerical simulation of the dynamic effects due to impeller-volute interaction in a centrifugal pump. Transactions of the ASME, Vol. 124, Issue 2, 2002, p. 348-355.
-
Asuaje Miguel, Bakir Farid, Kouidri Smaine, et al. Numerical modelization of the flow in centrifugal pump: volute influence in velocity and pressure fields. International Journal of Rotating Machinery, Vol. 3, 2005, p. 244-255.
-
Rodriguez C. G. Frequencies in the vibration induced by the rotor stator interaction in a centrifugal pump turbine. Journal of Fluids Engineering, Vol. 129, Issues 11-2007, 2007, p. 1428-1435.
-
Dürrer Bernd, Wurm Frank Hendrik Noise sources in centrifugal pumps. Proceedings of the 2nd WSEAS International Conference on Applied and Theoretical Mechanics, Venice, Italy, 2006, p. 203-207.
-
Lighthill M. J. On sound generated aerodynamically: I. General theory. Proceedings of the Royal Society of London A, Vol. 211, 1952, p. 564-87.
-
Dong R., Chu S., Katz J. Effect of modification to tongue and impeller geometry on unsteady flow, pressure fluctuations, and noise in a centrifugal pump. ASME Journal of Fluids Engineering, Vol. 119, Issue 3, 1997, p. 506-515.
-
Chu S., Dong R., Katz J. Relationship between unsteady flow, pressure fluctuations, and noise in a centrifugal pump-part A: use of PDV data to compute the pressure field. Journal of Fluids Engineering, Vol. 117, 1995, p. 24-29.
-
Chu S., Dong R., Katz J. Relationship between unsteady flow, pressure fluctuation, and noise in a centrifugal pump-part B: effects of blade tongue interactions. Journal of Fluids Engineering, Vol. 117, 1995, p. 30-35.
-
Yang S. S., Liu H. L., Kong F. Y., et al. Effects of the radial gap between impeller tips and volute tongue influencing the performance and pressure pulsations of pump as turbine. Journal of Fluids Engineering, Vol. 136, Issues 5-2014, 2014, p. 150-164.
-
Weidong S., Lei Z., Bin C., et al. Influence of gap on pressure pulsation and radial force of centrifugal pumps. Journal of Drainage and Irrigation Machinery Engineering, Vol. 30, Issue 3, 2012, p. 260-264.
-
Benra F. K. Numerical and experimental investigation on the flow induced oscillations of a single-blade pump impeller. Journal of Fluids Engineering, Vol. 128, 2006, p. 783-793.
-
Benra F. K., Dohmen Hans Josef Comparison of pump impeller orbit curves obtained by measurement and FSI simulation. Proceedings of IPC 2007, p. 26149.
-
Gülich J. F. Centrifugal Pumps. Springer, Berlin, 2008.
-
Guan Xingfang Modern Pumps Theory and Design. China Space Navigation Press, 2010.
-
Gonzãąlez J. Ã. Š., Parrondo J., Santolaria C., et al. Steady and unsteady radial forces for a centrifugal pump with impeller to tongue gap variation. Journal of Fluids Engineering, Vol. 128, Issue 3, 2006, p. 454-462.
-
Xinhua M. A., Qi F., Jiang X., et al. Influence of guide vane blade number on pressure fluctuation in multistage centrifugal pump. Journal of Drainage and Irrigation Machinery Engineering, Vol. 34, 82016, p. 665-671.
-
Zhang Jinfeng, Huang Xi, Yuan Shouqi, et al. Grid-independence in low specific speed centrifugal pump based on PIV. Journal of Drainage and Irrigation Machinery Engineering, Vol. 34, Issue 7, 2016, p. 567-572.
-
ANSYS, Inc., ANSYS CFX Tutorials 14.5. USA, 2012.
-
Huang S., Zhang J., Zhang X., et al. Numerical simulation of transient flow performance during different periods in centrifugal pump. Journal of Drainage and Irrigation Machinery Engineering, Vol. 34, Issue 9, 2016, p. 737-741.
-
Stel H., Amaral G. D. L., Negrão C. O. R., et al. Numerical analysis of the fluid flow in the first stage of a two-stage centrifugal pump with a Vaned diffuser. Journal of Fluids Engineering, Vol. 135, Issue 7, 2013, p. 235-244.
-
Shi F. Numerical study of pressure fluctuations caused by impeller-diffuser interaction in a diffuser pump stage. Journal of Fluids Engineering, Vol. 123, Issue 3, 2001, p. 466-474.
-
Liu Houlin, Wang Kai, Kim Hyoung Bum, et al. Experimental investigation of the unsteady flow in a double-blade centrifugal pump impeller. Science China-Technological Science, Vol. 56, Issue 4, 2013, p. 812-817.
-
Benra F. K., Dohmen H. J., Sommer M. Periodically unsteady flow in a single-blade centrifugal pump: numerical and experimental results. ASME Fluids Engineering Division Summer Meeting, 2005, p. 1223-1231.
-
Feng J., Benra F. K., Dohmen H. J. Unsteady flow visualization at part-load conditions of a radial diffuser pump: by PIV and CFD. Journal of Visualization, Vol. 12, Issue 1, 2009, p. 65-72.
-
Li Z., Wu P., Wu D., et al. Experimental and numerical study of transient flow in a centrifugal pump during startup. Journal of Mechanical Science and Technology, Vol. 25, Issue 3, 2011, p. 749-757.
-
Pjorge P., Javier P., Raúl B., et al. A simple acoustic model to characterize the internal low frequency sound field in centrifugal pumps. Applied Acoustics, Vol. 72, Issue 1, 2011, p. 59-64.
-
Howe M. S. On the estimation of sound produced by complex fluid-structure interactions, with application to a vortex interacting with a shrouded rotor. Mathematical and Physical Sciences, Vol. 433, 1991, p. 573-598.
About this article

This work was supported by National Natural Science Foundation of China (Grant No. 51609106, 51279069, 11602097), Natural Science Foundation of Jiangsu Province (Grant No. BK20150508), Scientific Research Project of Jiangsu University (Grant No. KYLX_1043).
Zhang Desheng conceived and designed the work that led to the results, acquired data, and played an important role in interpreting the results; approved the final version; revised the manuscript. Tan Linwei present some important ideas about the paper; draft the manuscript, done numerical calculation and experiment. Shi Weidong present some important ideas about the paper, revised the manuscript, done experiment. Zhou Ling done numerical calculation, revised the manuscript. Cai Xiaotong done numerical calculation, assist to complete experiment.
