Abstract
An experiment was conducted in a deep water basin to investigate the vortex-induced vibration mechanism of a drilling riser. Various measurements were obtained by the fiber Bragg grating strain sensors, and data was analyzed by modal analysis method. Results show that the vibration mode of the drilling riser increases with the increasing flow velocity, and the vibration amplitude in the CF direction is larger than that in the IL direction. The vibrations in the CF and IL directions interact and mutually affect each other. The vibration mode in the IL direction is usually larger than that in the CF direction as the dominant vibration frequency is twice of that in the CF direction. Higher stresses may occur rather in the IL direction than in the CF direction. Hence, fatigue induced by the IL direction should also be taken into consideration when analyzing the fatigue life of a drilling riser. The three-time harmonic appears, and the phenomenon becomes more obvious as the flow velocity increased for the effect of the “2T” wake mode under the experiment condition. Displacement trajectories are significantly influenced by dominant vibration frequency and phase angle between the CF and IL directions. Crescent shapes, figure-eight, and inclined figure-eight are appeared in the experiment with the increasing flow velocity.
1. Introduction
Drilling risers are conduits that provide temporary extension of a subsea blowout preventer on a surface drilling platform. Typically, the drilling riser is a slender, flexible, and cylindrical structure allocated in a marine edifice. When the ocean current flows across the drilling riser, initial deformation in the in-line (IL) direction will take place because of the ocean current induced the initial drag force. A vortex which can induce significant vibrations in the drilling riser in the cross-flow (CF) and IL directions may also be generated. This vibration is called as a vortex-induced vibration (VIV). VIV is an important fluid-structure interaction problem that can cause significant fatigue in the drilling riser that could result in accidents.
Over the past decades, many studies have focused on VIV. The VIV mechanism and previous studies have been reviewed by Sarpkaya [1, 2] Bearman [3, 4], Williamson and Govardhan [5], [6], Gabbai and Benaroya [7], Kumar et al. [8], and Wu and Hong [9]. VIV is a complicate nonlinear dynamics problem. An experiment is a good way to investigate its mechanism. Researchers carried out many experiments to investigate the VIV mechanism. Williamson et al. [10, 11] gained a significant progress in low mass-damping of VIV, and determined that the vibration amplitude in the CF direction was about 1.5 times that of the size of the cylinder diameter, which was defined as the “super upper regime”. They also investigated the wake mode and discovered the “2T” mode. Sumner and Akosile [12] conducted a VIV experiment with Reynolds number ranging from 4×10⁴ to 9×10⁴, and determined that low to moderate shear caused a small increase in the Strouhal number. Chaplin et al. [13] conducted a study on the VIV of a vertical tension riser in a stepped current and determined the existence of multi-frequency. The study also found out that vibration in the IL direction might cause as many damages as vibration in the CF direction. Trim et al. [14] conducted an experiment in the Marintek’s Ocean Basin to study VIVs of long helical strakes risers and found a quite distinct VIV response of the bare riser. Lie and Kaasen [15] utilized a large-scale VIV model and user modal analysis method for data processing and found that the dominant frequency in the IL direction was typically twice that of the Strouhal frequency under their test conditions. Marcollo and Hinwood [16] designed a new experiment setup to investigate the VIV mechanism and found that IL VIV could occur at low Ur in a shear flow. Vandiver et al. [17] conducted an experiment in the ocean on a flexible cylinder with the length of 152.4 m. Larsen and Halse compared different theoretical models for VIV of slender marine structures. Guo and Lou [18] studied the effects of internal flow on VIV of risers through an experiment and found that the vibration amplitude increased while vibration frequency decreased when the internal flow speed was increasing. Raghavan and Bernitsas [19] carried out an experiment in the Low Turbulence Channel at the University of Michigan to investigate the Reynolds number effect on VIVs and found that a high Reynolds number had stronger influence than mass ratio on A/D. Huera-Huarte et al. [20] studied VIVs of long flexible cylinders with low mass ratio through towing tank experiments and showed that the maximum amplitudes of more than three diameters in the model were with the lowest mass ratio. Kang and Jia [21, 22] carried out an experiment to investigate the two degrees of freedom for VIV trajectories and determined that the riser trajectory appeared to have various motion forms in addition to the figure eight shape. Chen et al. investigated the VIV of a flexible inclined cable under a shear flow and found that the shedding frequencies well coincided with the vibration modes. Liu et al. [23] investigated VIV under shear flow and the effect of drilling pipe on riser vibration. Their results revealed that the drilling pipe could inhibit vibration amplitude.
Nevertheless, a drilling riser is a slender, flexible, cylindrical structure, the VIV experiment that considers this structure is still scare. This study aims to investigate the VIV mechanism of drilling risers under the effect of uniform flow. In order to investigate VIV mechanisms more thoroughly, the experiment was carried out in a deepwater basin in the Shanghai Jiao Tong University. The instrumented drilling riser was made of PVC with the length of 8 m and outer diameter of 0.025 m. A drilling riser model was towed vertically and connected to two horizontal tracks by two radial spherical plain bearings in a deepwater basin. Various measurements were obtained by the fiber Bragg grating (FBG) strain sensors, and their data was analyzed by the modal analysis method. The standard deviation of displacement, displacement-time history and corresponding FFT spectra, and displacement trajectories were analyzed. The VIV mechanism of a drilling riser under the uniform flow was investigated.
2. Experimental
2.1. Experimental facility
The experiment was carried out in a test basin at the Shanghai Jiao Tong University. The experimental setup consisted of two horizontal tracks, two servo motors, one drilling riser, two radial spherical plain bearings, and a data acquisition system. Uniform flow can be generated by the synchronous movement of two horizontal tracks, and flow velocity can be controlled by the rotation speed of servo motors. A radial spherical plain bearing was used to simulate the flexible joint. The drilling riser were towed vertically and connected to two horizontal tracks using two radial spherical plain bearings. The schematic diagram of the entire experimental facility is depicted in Fig. 1(a) and the experiment photo is shown in Fig. 1(b) [23].
2.2. Experimental detail
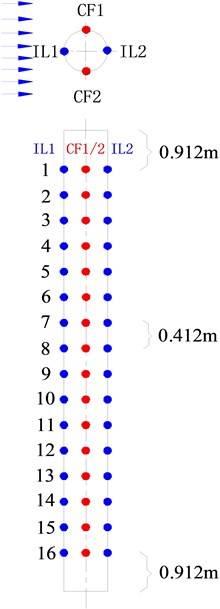
The model was designed using a PVC tube and its basic parameters are listed in Table 1. Sixty-four FBG sensors were used to capture the experimental data in four directions, called “CF_1”, “CF_2”, “IL_1” and “IL_2”, respectively (Liu et.al, 2014). Each direction has sixteen locations to capture the experimental data. The arrangement of FBG sensors for the model is depicted in Fig. 2. The sampling rate was 250 Hz.
Fig. 1Simplified sketch of experiment setup
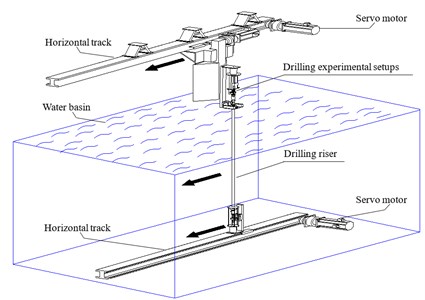
a) Entire experimental facility
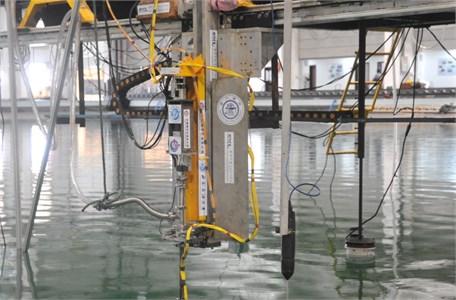
b) Experimental photo
Drilling riser. which is connected with a flexible joint at the two ends, can be regarded as a simply supported beam. Therefore, the riser natural frequency in still water can be determined by Eq. (1) [15]:
where is the riser pre-tension in N, is the riser length in m, is the vibration mode, is the riser stiffness in N·m2, is the mass in kg/m.
And the calculated riser model natural frequency in still water with pre-tension of 25 N is shown in Table 2.
Table 1Basic parameters of drilling riser model
Item | Value |
Model length (m) | 8 |
Thickness (m) | 0.0025 |
Out diameter (m) | 0.025 |
Mass in air (kg∙m3) | 1570 |
Bending stiffness (N∙m2) | 36 |
Basin water density (kg/m3) | 1000 |
Pre-tension (N) | 25 |
Table 2Natural frequency of experimental drilling riser model in still water with pretension of 25 N
First ordernatural frequency (Hz) | 0.45 |
Second ordernatural frequency (Hz) | 1.15 |
Third ordernatural frequency (Hz) | 2.11 |
Fig. 2Arrangement of FBG sensors for drilling riser model
2.3. Data process
VIV responses captured by FBG sensors are the wavelength data. These values can be transformed into the micro-strain values by the following Eq. (2):
where is the micro-strain; is the wavelength data captured by FBG sensors in m.
The riser displacement standard deviation and displacement-time history can be obtained by the modal analysis method. The detailed model analysis method for analyzing experimental data was introduced in references [15, 24]. The dominant frequency can be calculated from the fast Fourier transform of the displacement time-history. Furthermore, static deformation in the IL direction is eliminated through the averaging method.
3. Results
3.1. Analysis of displacement standard deviation of drilling riser
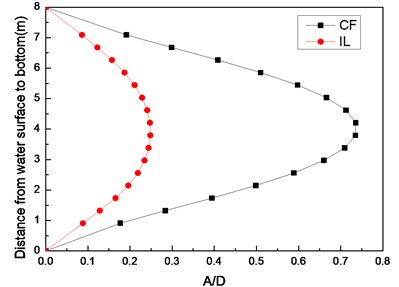
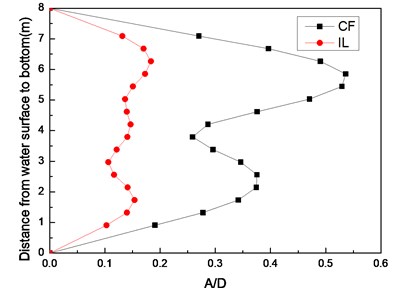
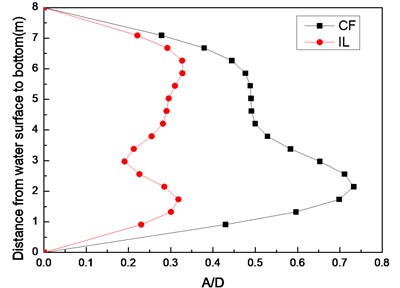
Fig. 3 shows the riser model standard deviation of the displacement with a pre-tension of 25 N and flow velocities of 0.1, 0.2, and 0.3 m/s. Only one crest appears in the CF and IL directions, indicating that the vibration mode is the first-order mode in these two directions at the flow velocity of 0.1 m/s as shown in Fig. 3(a). Figs. 3(b) and Figs. 3(c) show that two crests appear in the CF direction while three crests appear in the IL direction, indicating that the vibration mode in the CF direction is the second-order mode, and the vibration mode in the IL direction is the third-order mode with a flow velocity of 0.2 and 0.3 m/s. Fig. 3 also shows that the vibration amplitude of CF direction is much larger than the vibration amplitude of IL direction.
Fig. 3Standard deviation of displacement along riser model with pre-tension of 25 N at different flow velocities: a) flow velocity of 0.1 m/s; b) flow velocity of 0.2 m/s; c) flow velocity of 0.3 m/s
a)
b)
c)
3.2. Analysis of displacement time-history and corresponding vibration frequency
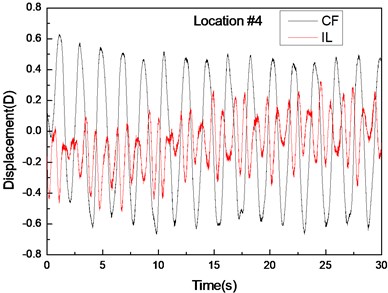
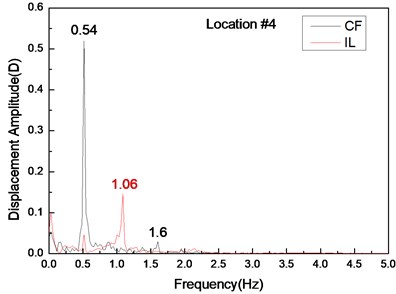
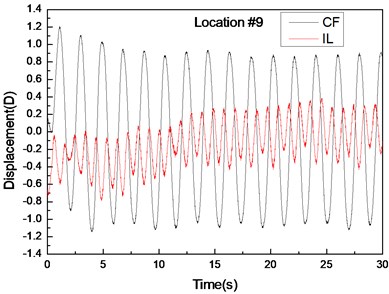
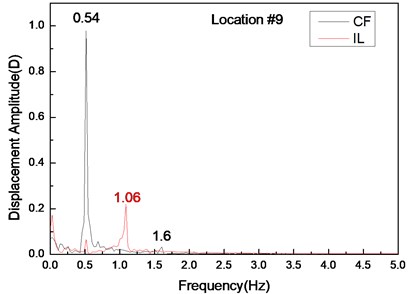
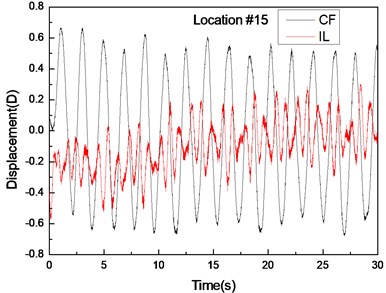
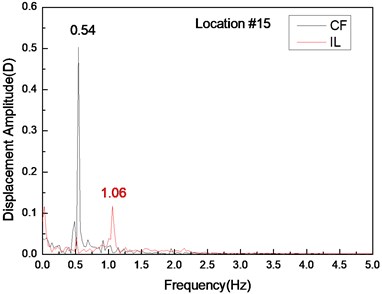
Fig. 4 shows the displacement responses at locations 4, 9, and 15 with pre-tension of 25 N and flow velocity of 0.1 m/s while Figs. 4(a), (c), and (e) represent the displacement–time history curves in the IL and CF directions. Figs. 4(b), (d), and (f) represent the vibration frequencies of two directions. The displacement time-history and vibration amplitude have regular variations in the CF direction, indicating that the vibration of the CF direction is stable. In contrast, the displacement time-history has an irregular variation and the vibration amplitude has fluctuated significantly in the IL direction. The figures also show that the vibration amplitude of two directions is much larger and more stable at location 9 than locations 4 and 9. Figs. 4 (b), (d), and (f) show that the dominant vibration frequencies of the CF and IL direction are 0.54 and 1.06 Hz.
Fig. 4Displacement responses at locations 4, 9, and 15 with pre-tension of 25 N and flow velocity of 0.1 m/s. a), c), and e) are the displacement–time history curves in the IL and CF directions; b), d), and f) are the corresponding FFT spectra in the IL and CF directions
a)
b)
c)
d)
e)
f)
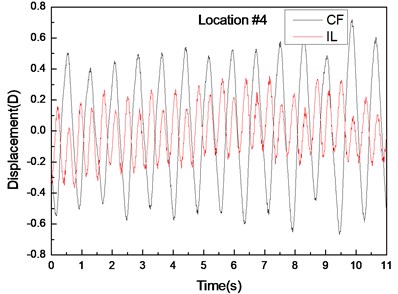
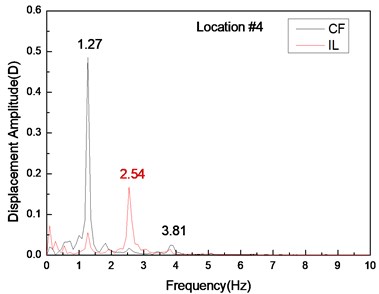
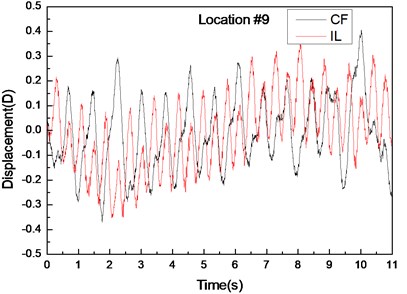
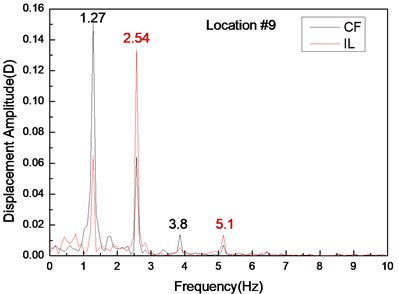
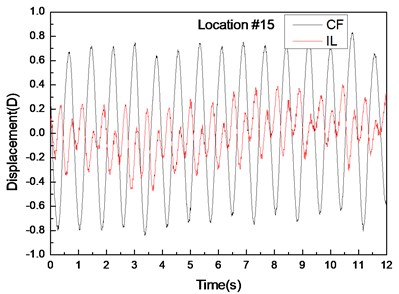
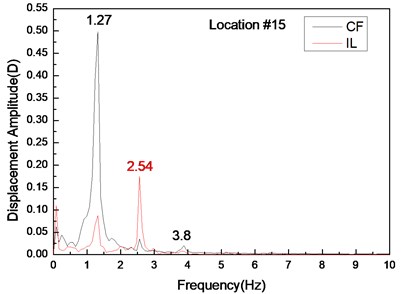
Fig. 5 depicts the displacement responses at locations 4, 9, and 15 with pre-tension of 25 N and flow velocity of 0.1 m/s. Figs. 5(a), (c), and (e) are the displacement-time history curves of IL and CF directions and Figs. 5(b), (d), and (f) represent the vibration frequencies of two directions. The variations in the displacement time-history and vibration amplitude at location 4 and 15 of these two directions are regular, whereas that for location 9 obviously fluctuated and were irregular. Figs. 5(b), (d), and (f) show that the dominant vibration frequencies of the CF and IL directions are 1.27 and 2.54 Hz, respectively.
Fig. 5Displacement responses at locations 4, 9, and 15 with pre-tension of 25 N and flow velocity of 0.2 m/s. a), c), and e) are the displacement-time history curves in the IL and CF directions; b), d), and f) are the corresponding FFT spectra in the IL and CF directions
a)
b)
c)
d)
e)
f)
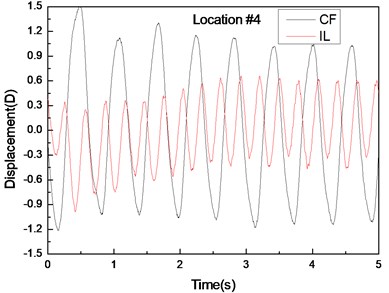
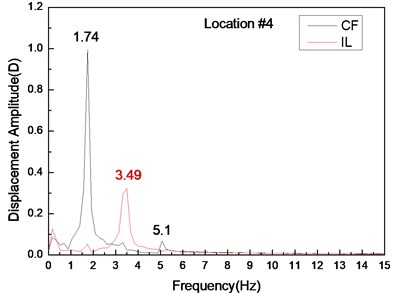
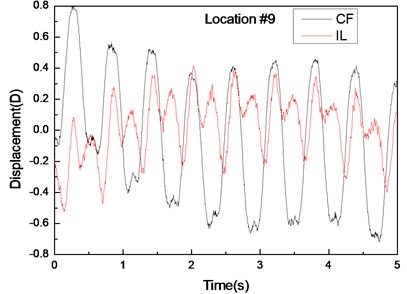
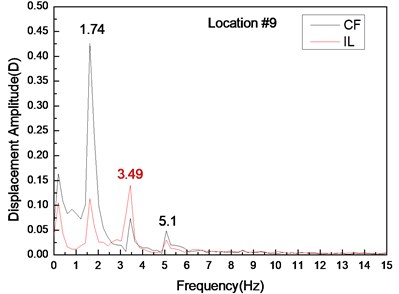
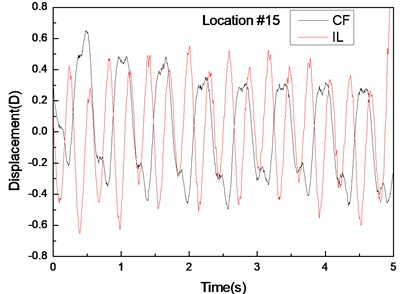
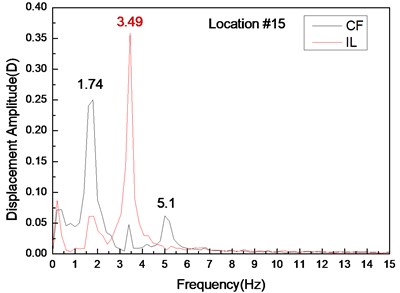
Fig. 6 depicts the displacement responses at locations 4, 9, and 15 with pre-tension of 25 N and flow velocity of 0.1 m/s. Figs. 6(a), (c), and (e) represent the displacement-time history curves, whereas Figs. 6(b), (d), and (f) are the vibration frequencies of the CF and IL directions. The displacement time-history and vibration amplitude of the CF and IL direction have regular variations at locations 4 and 15, whereas that in location 9 obviously fluctuated and was irregular. Figs. 6(b), (d), and (f) show that the dominant vibration frequencies of CF and IL directions are 1.27 and 2.54 Hz.
Fig. 6Displacement responses at locations 4, 9, and 15 with pre-tension of 25 N and flow velocity of 0.3 m/s. a), c), and e) are the displacement–time history curves in the IL and CF directions; b), d), and f) are the corresponding FFT spectra in the IL and CF directions
a)
b)
c)
d)
e)
f)
Figs. 4-6 indicate the vibrations in the CF and IL directions mutually appear in their respective FFT spectra, implying possible interactions between the vibrations in these two directions. The interactions obviously increase as flow velocity increases.
3.3. Analysis of displacement trajectories of drilling riser
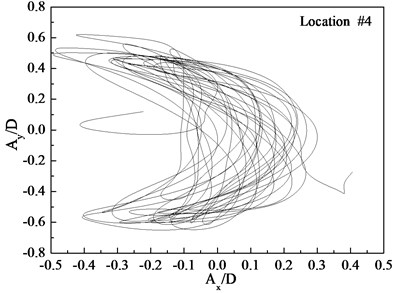
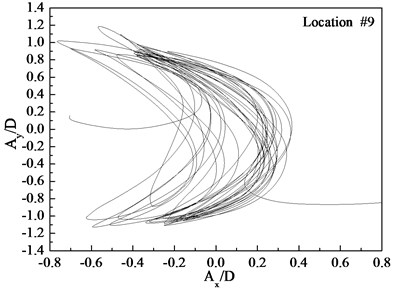
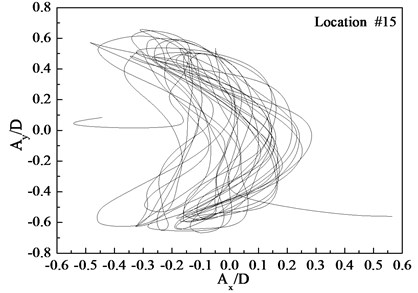
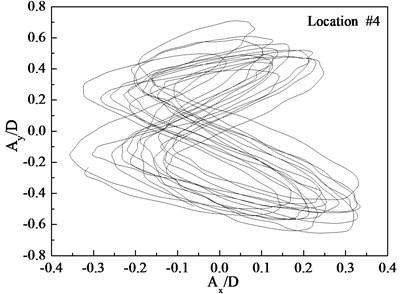
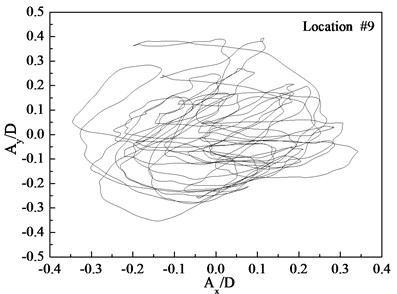
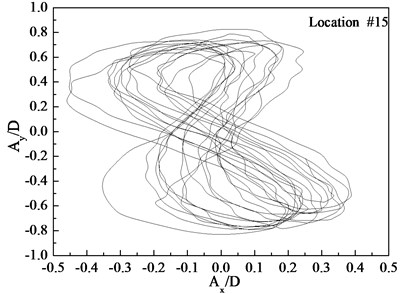
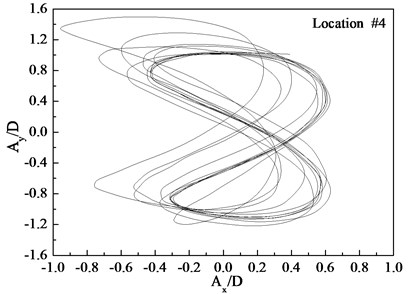
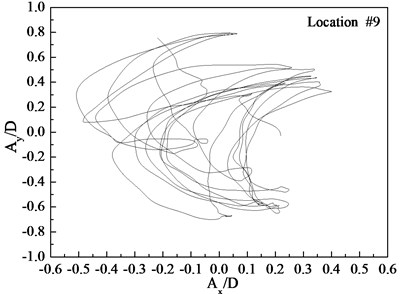
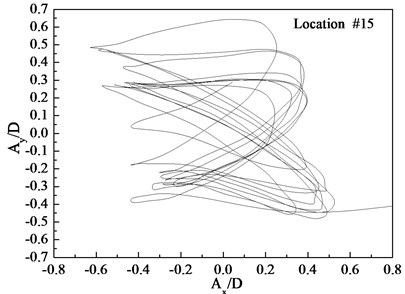
Figs. 7-9 depict the displacement trajectories at locations 4, 9, and 15 with pre-tension of 25 N and flow velocities of 0.1, 0.2, and 0.3 m/s. The displacement trajectories at locations 4, 9, and 15 appear as crescent shapes under a flow velocity of 0.1 m/s in Fig. 7. The displacement trajectories at locations 4, 9, and 15 appear as figure-eight shapes at the flow velocity of 0.2 m/s as depict in Fig. 8. The displacement trajectories at locations 4, 9, and 15 appear as inclined figure-eight shapes at the flow velocity of 0.3 m/s in Fig. 9. However, the displacement trajectories at location 9 appear to be irregular at the flow velocities of 0.2 and 0.3 m/s as shown in Figs. 8(b) and 9(b).
Fig. 7Displacement trajectories at location #4, 9, and 15 with pre-tension of 25 N with flow velocity of 0.1 m/s: a) location 4; b) location 9; c) location 15
a)
b)
c)
4. Discussion
The vortex shedding frequencies at different flow velocities can be calculated from the Strouhal relation [5]. Thus, the calculated vortex shedding frequencies with flow velocities of 0.1, 0.2, and 0.3 m/s are 0.68, 1.36, and 2.04 Hz, respectively. The calculated first, second, and third order natural frequencies of the riser are still at 0.42, 1.15, and 2.11 Hz as shown in Table 2. The dominant frequency with flow velocity of 0.1 m/s is 0.54 Hz, which approaches riser first-order natural frequency. The dominant frequency with the flow velocity of 0.2 m/s is 1.27 Hz, which approaches the riser second-order natural frequency. Several studies [5, 12] have shown that the “lock-in” phenomenon occurs while the vortex shedding frequency approaches the riser natural frequency. Under this phenomenon, the riser vibrates significantly at its natural frequency in the CF direction. Accordingly, while the flow velocity is 0.1 m/s, the “lock-in” phenomenon occurs in the first order mode. The riser vibrates in the first-order mode (Fig. 3(a)) with the dominant frequency of 0.54 Hz at the flow velocity of 0.1 m/s (Fig. 4). When the flow velocity is at 0.2 m/s, the “lock-in” phenomenon occurs in the second order mode. The riser vibrates in the second-order mode (Fig. 3(b)) with the dominant frequency of 1.27 Hz at the flow velocity of 0.2 m/s (Fig. 5). The natural frequency calculated by Eq. (5) is located in still water. However, the riser will generate the initial deformation for the drag force, and then vibrates in both the CF and IL directions. Riser tension during VIV will increase because of the effects of the initial deformation and vibration [23], thereby increasing the natural frequency of the riser during the VIV. Thus, we can see that the dominant vibration frequency is larger than the riser natural frequency. Moreover, the initial deformation in the IL direction and vibration amplitude cause an increasing flow velocity [25]. Accordingly, the real-time natural frequency with flow velocity of 0.3 m/s during the VIV is significantly larger than that in still water. The second natural frequency of the riser is 1.15 Hz in still water. For the effect of larger initial deformation in the IL direction and vibration, the real-time second and third order frequencies with the flow velocity of 0.3 m/s are much larger than 1.15 and 2.11 Hz, respectively. Therefore, the vortex shedding frequency approaches the second-order natural frequency with the flow velocity of 0.3 m/s. Consequently, the riser vibrates at the second-order mode (Fig. 3(c)), while the dominant vibration frequency of CF direction is 1.74 Hz (Fig. 6).
Fig. 8Displacement trajectories at location #4, 9, and 15 with pre-tension of 25 N with flow velocity of 0.2 m/s: a) location 4; b) location 9; c) location 15
a)
b)
c)
The Reynolds number at a different flow velocity can be calculated as follows [5]:
where is the outer diameter in m; is the kinematic viscosity in m2/s.
The Reynolds number ranges from 2500 to 7500 with the flow velocity ranging from 0.1 to 0.3 m/s, which are within the range of subcritical Reynolds numbers. However, although the Reynolds number within the subcritical range, the vortex street is fully turbulent, and the vortex sheds periodically [5]. Previous studies [6], [22] have shown that the vibration frequency of IL direction is affected by the form wake mode. Two separate vortices are formed at each period because of the effects of the “2S” mode [5]. The vortex has an influence on the riser in the CF direction once and twice in the IL direction. Thus, the lift force is twice that of the drag force. Accordingly, the dominant vibration frequency of IL direction is almost twice of the CF direction. The dominant vibration frequencies in the IL direction are 1.06, 2.54, and 3.49 Hz with the flow velocities of 0.1, 0.2, and 0.3 m/s. As analyzed above, the dominant vibration frequency of the IL direction with the flow velocity of 0.1 m/s approaches the first-order natural frequency, whereas the dominant vibration frequency in the IL direction with the flow velocity of 0.2 and 0.3 m/s approaches the third-order natural frequency. Thus, a riser vibrates at the first order mode with the flow velocity of 0.1 m/s and at the third-order mode with the flow velocity of 0.2 and 0.3 m/s. As shown above, the vortex shedding frequency increases as the flow velocity increases, which can be close to the high order mode of riser natural frequency. Thus, the vibration mode increases with the increasing flow velocity in the CF direction (Fig. 3). The dominant vibration frequency of IL direction is twice of the CF direction. Therefore, the vibration mode in the IL direction is higher (Fig. 3).
Fig. 9Displacement trajectories at location #4, 9, and 15 with pre-tension of 25 N with flow velocity of 0.3 m/s: a) location 4; b) location 9; c) location 15
a)
b)
c)
As the “lock-in” phenomenon occurs, the riser vibrates significantly in the CF direction. The lift force is much larger than the drag force [2]. Thus, the vibration amplitude of the CF direction is larger than that of the IL direction (Fig. 3). However, the vibration in the IL direction may be dominated by higher modes than the vibration in the CF direction. Higher stresses may occur in the IL direction. Hence, fatigue induced by IL direction should also be taken into consideration when analyzing the fatigue life of a drilling riser.
The vibrations in the CF and IL directions interact and mutually affect each other (Fig. 4-6). The phenomenon is caused by that the periodic variations in drilling riser tension induced by the vibrations in both two directions. While the drilling riser vibrates in the CF direction, riser tension will also vary with vibration frequency, resulting in the deformation of the riser [24], [25]. The VIV characteristics are determined mainly by tension and bending stiffness. Variations in the riser tension from the CF direction also have an effect on the IL direction. Therefore, the vibration frequency at the CF direction appears at the FFT spectra in the IL direction. From the same mechanism, the vibration in the IL direction also appears at the FFT spectra in the CF direction. Accordingly, the vibrations in two directions interact through the influence of riser tension.
The three-time harmonic appears, and the phenomenon becomes more obvious as the flow velocity increased (Fig. 4-6). The appearance of the three-time harmonic is consistent with the results of several studies. The phenomenon may be caused by the complicated form of the wake mode. Based on “2S” mode, two vortices were formed during one period. These vortices could be broken into three vortices. Therefore, the “2T” mode was formed [11]. During the one period of vortex shedding, these vortices also induced drilling riser vibration at three times the vibration frequency in the CF direction [22]. Thus, in addition to the dominant vibration frequency, the riser also vibrates with the three-time harmonic. The vortex induced force is more significant with the increasing flow velocity. Consequently, three harmonics are more obvious with the increasing flow velocity.
The experiment has typical two degrees of freedom for the VIV of the drilling riser. The trajectory shapes are determined by the dominant vibration frequency and phase angle between two-component displacements. For the dominant vibration frequency of the IL direction, which is twice of the CF direction, the drilling riser moves back and forth twice at every transverse vibration. Consequently, most of the trajectory shapes are based on the figure eight (Fig. 7-9). Streamwise and transverse displacements of the drilling riser immersed in a uniform flow can be represented as follows [5, 6]:
where is the vibration amplitude in the CF direction, represents the vibration amplitude in the IL direction, is the dominant vibration frequency, and is the phase angle between the two-component displacements.
The phase angle can be derived from Eqs. (11) and (12). The phase angles with the flow velocities of 0.1, 0.2, and 0.3 m/s are 60°, 200°, and 137°, respectively. Similar to the results of a previous study [25], trajectory shapes appear as crescent shapes when the flow velocity is 0.1 m/s, and the phase angle is 90°. The trajectory shapes appear as a figure eight when the flow velocity is 0.2 m/s, and the phase angle is 200°. The trajectory shapes appear as inclined figure eight when the flow velocity is 0.3 m/s, and the phase angle is 137°. Multi-frequency is significant at location 9 when the flow velocity is 0.2 and 0.3 m/s, and therefore, the trajectory shapes are irregular as depicted in Figs. 8(b) and (b).
5. Conclusions
In this paper, an experiment was conducted to investigate the VIV mechanism of the drilling riser. Displacement standard deviation, displacement time-history and vibration frequency, and displacement trajectories were analyzed.
1) The vibration mode of the drilling riser increases with the increasing flow velocity and the vibration amplitude in the CF direction is larger than that in the IL direction.
2) The vibrations in the CF and IL directions interact and mutually affect each other for the periodic variations in the drilling riser tension induced by the vibrations in both the CF and IL directions.
3) The vibration mode in the IL direction is usually larger than that in the CF direction as the dominant vibration frequency is twice of that in the CF direction. Consequently, higher stresses may occur rather in the IL direction than in the CF direction. Hence, fatigue induced by the IL direction should also be taken into consideration when analyzing the fatigue life of a drilling riser.
4) The three-time harmonic appears, and the phenomenon becomes more obvious as the flow velocity increased for the effect of the “2T” wake mode under the experiment condition.
5) Displacement trajectories are significantly influenced by the dominant vibration frequency and phase angle between the CF and IL directions. Crescent shapes, figure-eight, and inclined figure-eight are appeared in the experiment with the increasing flow velocity.
References
-
Sarpkaya T. Vortex-induced oscillations: a selective review. Journal of Applied Mechanics, Vol. 46, Issue 2, 1979, p. 241-258.
-
Sarpkaya T. A critical review of the intrinsic nature of vortex-induced vibrations. Journal of Fluids and Structures, Vol. 19, Issue 4, 2004, p. 389-447.
-
Bearman P. W. Vortex shedding from oscillating bluff bodies. Annual Review of Fluid Mechanics, Vol. 16, Issue 1, 1984, p. 195-222.
-
Bearman P. W. Circular cylinder wakes and vortex-induced vibrations. Journal of Fluids and Structures, Vol. 27, Issue 5, 2011, p. 648-658.
-
Williamson C. H. K., Govardhan R. Vortex-induced vibrations. Annual Review of Fluid Mechanics, Vol. 36, 2004, p. 413-455.
-
Williamson C. H. K., Govardhan R. A brief review of recent results in vortex-induced vibrations. Journal of Wind Engineering and Industrial Aerodynamics, Vol. 96, Issue 6, 2008, p. 713-735.
-
Gabbai R. D., Benaroya H. An overview of modeling and experiments of vortex-induced vibration of circular cylinders. Journal of Sound and Vibration, Vol. 282, Issue 3, 2005, p. 575-616.
-
Kumar R. A., Sohn C. H., Gowda B. H. L. Passive control of vortex-induced vibrations: an overview. Recent Patents on Mechanical Engineering, Vol. 1, Issue 1, 2010, p. 1-11.
-
Wu X., Ge F., Hong Y. A review of recent studies on vortex-induced vibrations of long slender cylinders. Journal of Fluids and Structures, Vol. 28, 2012, p. 292-308.
-
Khalak A., Williamson C. H. K. Motions, forces and mode transitions in vortex-induced vibrations at low mass-damping. Journal of fluids and Structures, Vol. 13, Issue 7, 1999, p. 813-851.
-
Williamson C. H. K., Jauvtis N. A high-amplitude 2T mode of vortex-induced vibration for a light body in XY motion. European Journal of Mechanics – B/Fluids, Vol. 23, Issue 1, 2004, p. 107-114.
-
Sumner D., Akosile O. O. On uniform planar shear flow around a circular cylinder at subcritical Reynolds number. Journal of Fluids and Structures, Vol. 13, Issue 8, 2003, p. 441-454.
-
Chaplin J. R., Bearman P. W., Cheng Y., et al. Blind predictions of laboratory measurements of vortex-induced vibrations of a tension riser. Journal of Fluids and Structures, Vol. 21, Issue 1, 2005, p. 25-40.
-
Trim A. D., Braaten H., Lie H., et al. Experimental investigation of vortex-induced vibration of long marine risers. Journal of Fluids and Structures, Vol. 21, Issue 3, 2005, p. 335-361.
-
Lie H., Kaasen K. E. Modal analysis of measurements from a large-scale VIV model test of a riser in linearly sheared flow. Journal of Fluids and Structures, Vol. 22, Issue 4, 2006, p. 557-575.
-
Marcollo H., Hinwood J. B. On shear flow single mode lock-in with both cross-flow and in-line lock-in mechanisms. Journal of Fluids and Structures, Vol. 22, Issue 2, 2006, p. 197-211.
-
Vikas J., Vandiver J. K. Incorporating the higher harmonics in VIV fatigue predictions. 26th OMAE, CA, 2007, p. OMAE2007-29352.
-
Guo H. Y., Lou M. Effect of internal flow on vortex-induced vibration of risers. Journal of Fluids and Structures, Vol. 2, Issue 4, 2008, p. 496-504.
-
Raghavan K., Bernitsas M. M. Experimental investigation of Reynolds number effect on vortex induced vibration of rigid circular cylinder on elastic supports. Ocean Engineering, Vol. 38, Issue 5, 2011, p. 719-731.
-
Huera-Huarte F. J., Gharib M. Flow-induced vibrations of a side-by-side arrangement of two flexible circular cylinders. Journal of Fluids and Structures, Vol. 27, Issue 3, 2011, p. 354-366.
-
Kang Z., Jia L. An experiment study of a cylinder's two degree of freedom VIV trajectories. Ocean Engineering, Vol. 70, 2013, p. 129-140.
-
Kang Z., Jia L. S. An experimental investigation of one-and two-degree of freedom VIV of cylinders. Acta Mechanica Sinica, Vol. 29, Issue 2, 2013, p. 284-293.
-
Liu Q., Mao L., Zhou S. Experimental study of the effect of drilling pipe on vortex-induced vibration of drilling risers. Journal of Vibroengineering, Vol. 16, Issue 4, 2014, p. 1842-1853.
-
Mao Liangjie, Liu Qingyou, Zhou Shouwei Experimental study of the vortex-induced vibration of drilling risers under the shear flow with the same shear parameter at the different Reynolds numbers. PloS One, Vol. 9, Issue 8, 2014, p. e104806.
-
Leong C. M., Wei T. Two-degree-of-freedom vortex-induced vibration of a pivoted cylinder below critical mass ratio. Proceedings of the Royal Society of London A: Mathematical, Physical and Engineering Sciences, The Royal Society, Vol. 464, Issue 2099, 2008, p. 2907-2927.
About this article

The authors gratefully acknowledge the Financial Support of the Young Scholars Development Fund of SWPU (201599010089) and the National Natural Science Foundation of China (51604235).
