Abstract
Metro depots are places for subway train to get parked and maintained. To avoid the waste of large city areas occupied by depots, there is a need of developing depots for commercial and/or residential use as well, and in that case the train-induced vibrations become the major concern. This paper presents a unique case study on the vibration measurement in a 3-story metro depot, where the first two stories are developed for offices and shops and the third story is used as the maintenance garage with trains moving in/out through the connecting viaducts. Acceleration time histories of rails and floors in the three stories were measured. Amplitudes and frequency contents of the vibrations at different locations are compared through the corresponding frequency spectra and 1/3 octave band root-mean-square (RMS) spectra. The influence of track positions on floor vibration is investigated, and the vibration level of the building is evaluated using two indicators. Finally, numerical simulation is carried out so as to provide some references to the vibration control.
1. Introduction
Subway transportation is an important component of unban traffic system, providing rapid, punctual and convenient access to places in dense urban environments. However, people living in the vicinity of subway lines may suffer from the train-induced vibration and noise, which has become a worldwide problem [1]. So far a number of researches have been carried out experimentally and analytically with regards to the train-induced vibration, and in general the following three aspects are the focus: (I) vehicle-track system dealing with vibration generation [2-6], (II) soil system dealing with vibration propagation [7-10], and (III) building system dealing with structural responses (i.e. vibrations and noise, etc.) [11-13]. Theses researches give an insight into the generation and propagation mechanism of train-induced vibration, based on which analytical models with increasing accuracy and vibration mitigation measures have been proposed.
Among existing studies, there is an increasing interest in the over-track buildings which are widely adopted along the subway lines to achieve rational land utilization and economic benefits [14]. However, the vibration waves that are generated at the rail-wheel interface can be transmitted to the building directly or at a short distance, containing high energy that may cause excessive vibration of the building and lead to the discomfort of the inhabitants. Sanayei et al. [15] measured the surface train and subway-induced vibrations on the foundation slab inside six buildings, which were compared with those in the adjacent open fields, and concluded that frequency range of significant velocity level was in the range of 10-250 Hz. Zhou et al. [14] numerically simulated vibrations of an over-track building, and showed that the vibration level of each floor reached to an extent that the occupants may feel discomfort. Sanayei et al. [16] proposed an impedance model to predict the response of the column-floor joint subjected to a surface train. Zou et al. [17] performed field tests in a metro depot and suggested that vibrations with low and medium frequencies should be the emphasis for consideration. Hou et al. [18] proposed a numerical model for predicting the vibration of a building with an inside subway line, and found that vibration of the first floor exceeded the threshold of human perception.
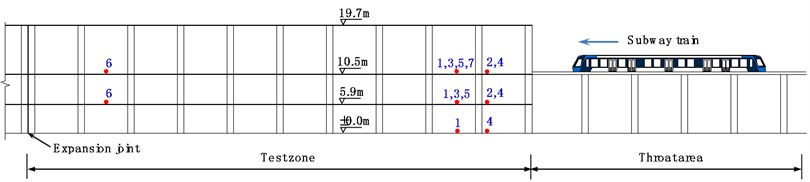
In previous investigations, vibrations of over-track buildings were induced by trains running either on the ground or in tunnels underneath the buildings, as shown in Fig. 1(a)-(c). This paper, however, reports a unique measurement in a 3-story metro depot, where the third story is used as the maintenance garage with trains moving in/out through the connecting viaducts, as shown in Fig. 1(d). The first two stories of the building are designed as offices and shops to avoid the waste of large areas occupied by the depot. As a result, the train-induced vibrations become one major concern. In this study, acceleration time histories of rails and floors in the three stories were measured. Amplitudes and frequency contents of the vibrations at different locations are compared with regards to the corresponding frequency spectra and 1/3 octave band root-mean-square (RMS) spectra. The influence of track positions on floor vibration is investigated, and the vibration level of the building is evaluated using various indicators. In addition, the influence of track configuration, floor thickness and column section dimension is studied to provide some references to the vibration control. Considering that previously no measurement has been carried out in such depots, the presented study provides new knowledge on the train-induced vibrations and references to the design of novel metro depots.
Fig. 1Various locations of the train
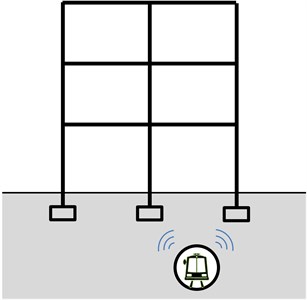
a) In the tunnel underneath the building [13, 15]
b) On the outside road [11]
c) On the ground floor [16-18]
d) On the top story (in this study)
2. Test setup
2.1. Introduction to the metro depot and measure points
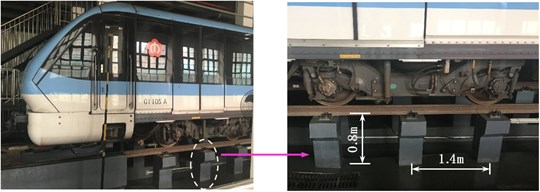
The metro depot under tests is a concrete frame structure with large open space and infilled walls. Most frame columns have the cross-section of 1.1 m×1.1 m except for some inner columns with the cross section of 0.8 m×0.8 m. Slab thicknesses of the second and third floors are 120 mm and 150 mm, respectively, and the heights of the first, second and third stories are 5.9 m, 4.4 m and 9.2 m, respectively.
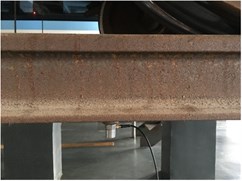
Fig. 2 illustrates the locations of the measure points numbered from 1-7 in the test zone, and note that the dotted lines numbering from 1 to 10 represent the tracks on the third floor. Vertical acceleration time histories were measured from these points during the passage of subway trains. Point 1 was set to measure the midspan vibrations of the slabs of the ground, second and third floors. Besides, horizontal accelerations were measured at point 1 for comparison. Point 2 and 3 were set to measure the vibrations of the beams in two orthogonal directions. Point 4 was set to measure the vibrations of the beam-column joints on each floor. Point 5 was set in comparison with Point 1 to study the effect of plate dimension, and in conjunction with Point 6 to obtain the passing time of train. Point 7 was set to measure the rail vibration. As shown in Fig. 4, a total of two accelerometers were installed on the rail, and their distances to the sleeper were 0.2 m and 0.7 m, respectively.
Fig. 2Locations of measure points in the test part
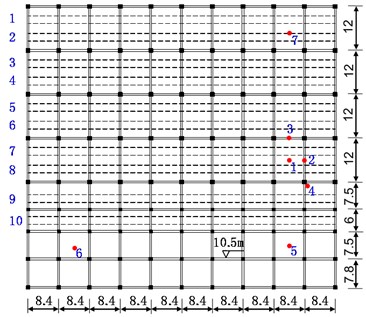
a) Plane layout of measure points
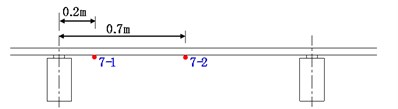
b) Accelerometers on the rail
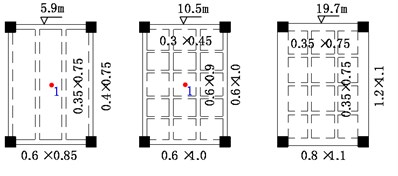
c) Dimensions of beams at three floors
d) Vertical position of measure points
2.2. Introduction to the train-track system
The subway train is a standard vehicle consisting of two trailer cars and four driving motor cars, corresponding to a rolling stock of 119.88 m. Tare mass of the trailer car and motor car are 30 t and 31.8 t, respectively. The bogie and axle spacing on the carriage are 12.6 m and 2.2 m, respectively, and the carriage is connected to the bogies and wheels through the suspension system. The primary suspension has a vertical stiffness of 1700 kN/m and the damping of 5 kN·s/m, while these two values are 275 kN/m and 30 kN·s/m for the secondary suspension. In normal service status, the train runs at a speed of 70 km/h, and the speed is controlled within 5 km/h when running in the metro depot. Note that currently there is no investigation on structural vibrations induced by trains with such low-speeds.
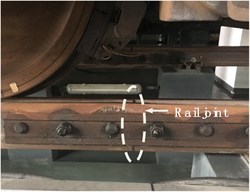
As shown in Fig. 3(a), the rails of the track system are rest on the reinforced concrete columns nominally spaced at 1.4 m on the third floor, and the columns with a uniform height of 0.8 m are constructed to leave space for maintenance. The U75v rail weighting 60.6 kg per meter is fixed on the columns by elastic bar fasteners which provide the local resilience and has a vertical static stiffness of approximately 40 kN/mm. The 25 m single rail is connected with each other through steel plates and bolts, producing an 8 mm wide rail joint, as shown in Fig. 3(b).
Fig. 3The track system
a) Rail and the support columns
b) Rail joint
2.3. Introduction to the test equipment
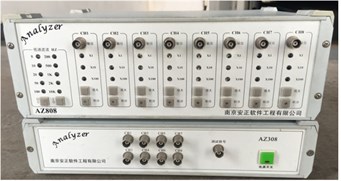
Fig. 4 shows the instrumentations used in the measurement. The type 941B ultra-low frequency accelerometers with the sensitivity of 0.3 V/m/s2 were glued on floors to measure the building vibration (i.e., measure points 1-6), while the piezoelectric accelerometer with a magnetic base was used to measure the rail vibration. Each accelerometer was connected to an amplifier, an anti-aliasing low-pass filter and a laptop successively. The sampling frequency of accelerometers on floors was 256 Hz, while that on the rail was 2000 Hz. In the following analysis and discussion, interferences due to walking people and occasional road traffic were neglected.
Fig. 4Measure instruments and accelerometers
a) Amplifier and filter
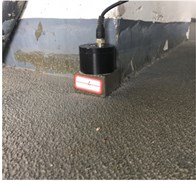
b) The 941B accelerometer
c) Piezoelectric accelerometer
3. Test results
3.1. Vibrations of rails
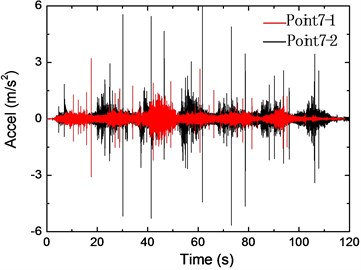
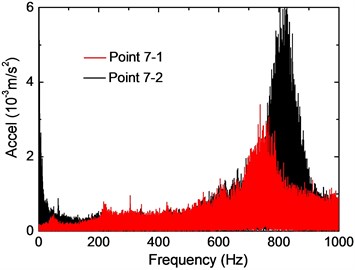
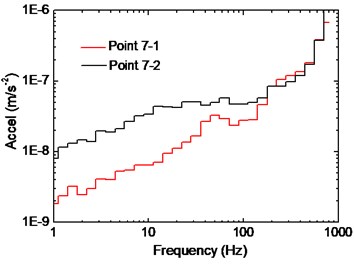
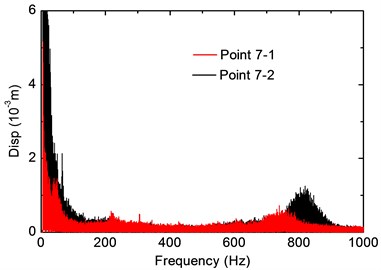
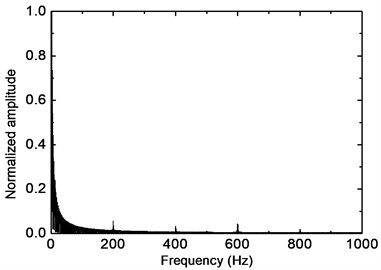
Fig. 5(a) shows the acceleration time histories of vertical rail vibrations, where the black and red lines are responses of Points 7-1 and 7-2, respectively. For the recorded train speed around 5 km/h, it can be concluded from the figure that the acceleration decreased rapidly at both two points. Response at the midspan of the rail is a little bit smaller, and peak values of the two points are observed around 6 m/s2 and 3 m/s2, respectively. A series of peaks can be observed in the time histories, which are considered as a result of the impact between the wheel and rail joints. Fig. 5(b) shows the frequency spectra, and the corresponding 1/3 octave RMS spectra are depicted in Fig. 5(c). Frequency distributions of the two points within 700 Hz are very similar, and the amplitude is very small as compared with the predominant frequency. The predominant frequency at the midspan of the rail is observed around 750 Hz, while for Point 7-1, the predominant frequency shifts to around 820 Hz. The midspan point shows a smaller vibration amplitude, which is considered as a result of the imperfect contact between the rail and the sleeper, and unexpected large vibration could occur at the contact area. According to Fig. 5(c), most of the vibration energy concentrate around 800 Hz. It is worth noting that the sampling frequency of 2 kHz is considered not high enough since the frequency contents of rail vibration extend around 1 kHz; however, the sampling rate in this research is acceptable due to that the main frequencies can be clearly identified. As shown in Fig. 5(d), most frequency contents of rail vertical displacements are within 100 Hz.
Fig. 5Vibration of the rail
a) Acceleration time-history
b) Acceleration frequency spectra
c) 1/3 octave RMS spectra
d) Displacement frequency spectra
3.2. Vibrations on slabs
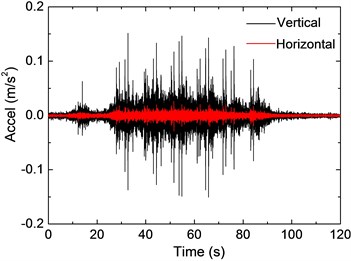
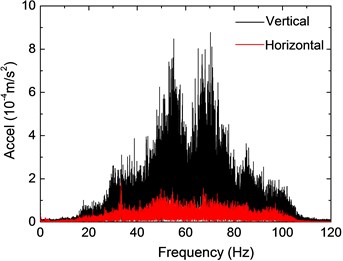
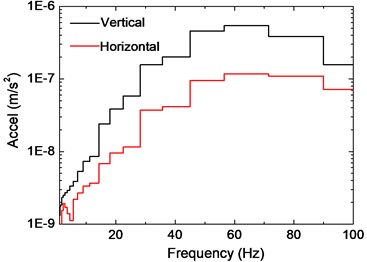
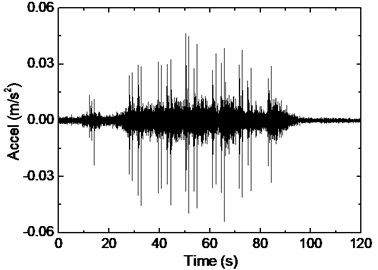
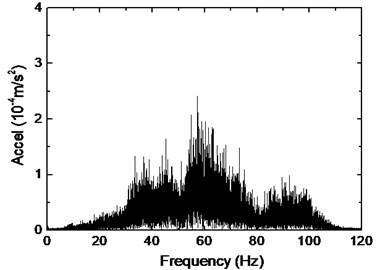
Fig. 6 plots the responses of the slab on the second floor under a moving train on Track No. 8, taken from Point 1, where the horizontal and vertical acceleration records are illustrated for comparison. The maximum acceleration up to 0.15 m/s2 in the vertical direction can be observed in Fig. 6(a), while the horizontal response is much smaller and the peak value is only 0.027 m/s2. Two predominant frequencies for vertical vibration can be observed around 50 Hz and 70 Hz; for horizontal vibration the predominant frequency can hardly be figured out, while frequency contents distribute mainly from 30 Hz to 90 Hz. The 1/3 RMS spectra show that vertical vibration energy concentrates around 60 Hz, and energy in the horizontal direction is negligible around that range. According to Fig. 6, it can be seen that vertical response of the slab is much more intense in terms of the peak acceleration value and frequency amplitude, and this should be the emphasis of human comfort evaluation.
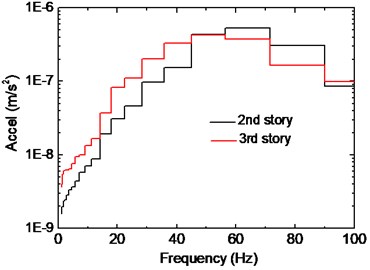
Fig. 7 compares the slab vibration at different stories; note that these records are all induced by the train on Track No. 8. In general, vibration response in the vertical direction is larger than that in the horizontal direction. Frequency amplitude of the first story is obviously smaller than the other two stories at both directions, indicating that only a small amount of energy has been transferred into the ground. When comparing vertical vibrations of the second and third stories, it can be found that amplitude around the predominant frequency has been amplified on the second floor, and the content below 40 Hz has been greatly attenuated during the propagation. As to horizontal vibrations, frequency attenuation is observed for the content below 20 Hz and above 80 Hz; beyond that range, the difference of the two floors is minor.
Fig. 6Midspan vibration of slab on the second floor (Point 1)
a) Acceleration time-history
b) Frequency spectra
c) 1/3 octave RMS spectra
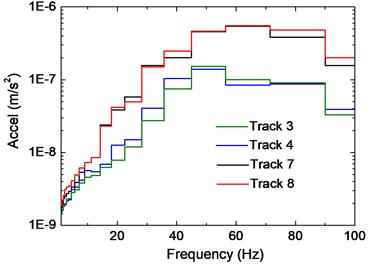
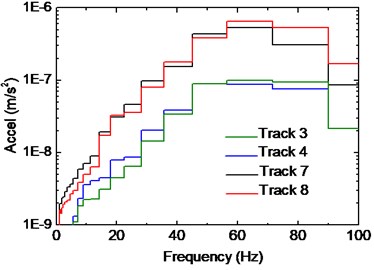
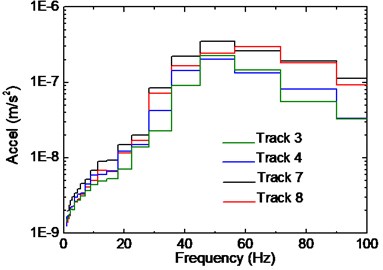
Fig. 8 illustrates the influence of track positions on vertical vibrations of slabs, and the curves are calculated from accelerometers on the second floor. Due to the limitation of measure time and operation requirement, only four records were obtained. It can be figured out that the 1/3 octave RMS spectra of adjacent tracks are similar. Note that Point 1 locates in the middle of Tracks No. 7 and 8, as a result, vibration energy caused by Tracks No. 3 and 4 is much smaller especially around the predominant frequency, since their distance to point 1 is larger and more energy has been dispersed during propagation. For tracks No. 3 and 4 that are more away from Point 1, vibration energy concentrates around 50 Hz, while for Tracks No. 7 and 8 the energy concentrates around 70 Hz.
Fig. 7Comparison of slab vibration of three floors
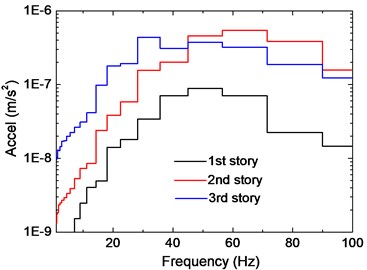
a) Vertical direction
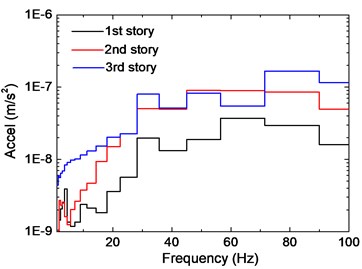
b) Horizontal direction
Fig. 8Influence of track position on slab vibration
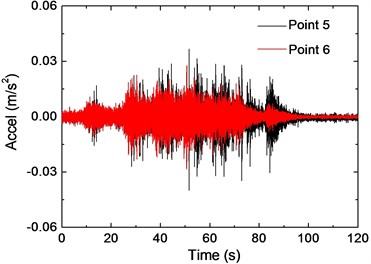
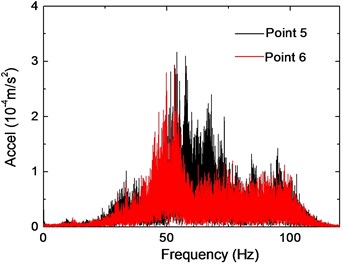
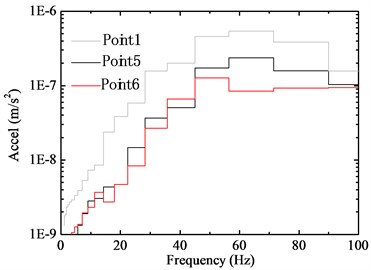
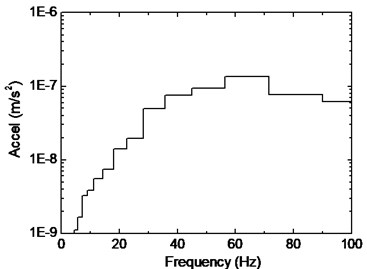
In addition, the vibration responses of Point 5 and 6 are plotted in Fig. 9 for comparison. The observed peak accelerations around 0.04 m/s2 are significantly smaller than that of Point 1. As the time history of the two points are compared, it can be found that the response of Point 5 is larger than that of Point 6 after 60 s, and this is considered as a result of the difference of train passing time. Fig. 9(b) shows the corresponding frequency spectra, and the predominant frequency is observed around 50Hz for both points. Compared with the spectrum of Point 1, it can be found that the frequency content around 70 Hz has attenuated significantly, and this can be validated by the 1/3 octave spectra in Fig. 9(c).
Fig. 9Vibration responses of Points 5 and 6 on the second floor
a) Acceleration record
b) Frequency spectra
c) 1/3 octave RMS spectra
Finally, to assess the rationality of the sampling frequency (256 Hz), a mass-spring-damper system subjected to a sinusoidal load is used, and the dynamic equation of the mass point can be written as:
Taking the response in the steady state into account, the acceleration amplitude is expressed as:
where , . It can be seen from the above the expression that if , the acceleration amplitude decreases as increases. Based on Eq. (2) and Fig. 5(d), it can be deduced that the dynamic response due to the frequency contents above 100 Hz is much smaller than the contents below 100 Hz (which is also validated by the test data). As a result, the sampling frequency of 256 Hz is thought to be acceptable in this study.
3.3. Vibrations of beams
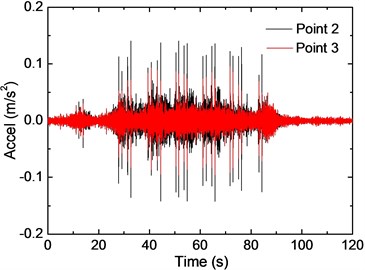
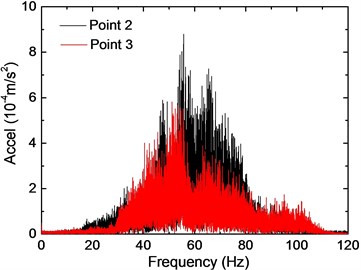
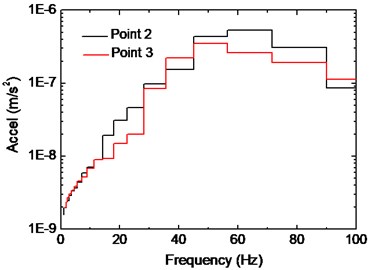
Fig. 10 depicts the vibration responses of two beams caused by a subway train on Track No. 7, taken from Points 2 and 3. The observed peak acceleration at Point 2 is slightly larger than that at Point 3, indicating that the beam with a longer span would have a larger vibration response. The acceleration time history indicates that vibration response of Point 2 is comparable to that of 1, which could be explained by the fact that secondary beams on the floor system have increased the stiffness of slab. As a result, the beam should not be simply viewed as clamped boundary of the slab when analyzing dynamic response of the slab. Fig. 10(b) describes the frequency distribution of the two points, where the predominant frequency is observed around 50 Hz. For Point 3 the contents within 50 Hz-80 Hz have attenuated significantly, which is in accordance with the corresponding 1/3 octave band RMS spectra.
Fig. 10Vibration of beams on the second floor
a) Acceleration time-history
b) Frequency spectra
c) 1/3 octave RMS spectra
The comparison of beam vibration at different stories is demonstrated in Fig. 11. Predominant frequency of the four curves locates around 50 Hz despite the position of measure points. It can be concluded that during the wave propagation (from third story to second story), frequency content below 40 Hz has attenuated significantly at both points, and this phenomenon can also be observed for the slabs. As to frequencies above 40 Hz, the trend of two points is quite different. For the beam with longer span (Point 2), frequency amplitude has been slightly amplified from 60 Hz to 80 Hz. For Point 3 the reduction is observed in the whole frequency band, where vibration energy of two stories is close around 50 Hz.
The influence of track position on beam vibration is shown in Fig. 12, and the records are selected from beams on the second floor. Similar to the slab response, adjacent tracks result in 1/3 octave RMS spectra with no significant difference, and frequency amplitude of the measure point generally decreases when the distance to the track increases. For Point 2 the amplitude attenuation is remarkable along the whole frequency band especially comparing the response of tracks No. 3 and 8. For Point 3 there is little difference for contents below 50 Hz, and the total difference of the curves is obviously smaller. Considering the direction of the tracks, this can be partly explained that frame columns between Point 2 and Track No. 3 have prevented propagation of the vibration wave to some extent, while for Point 3, fewer columns existed in the space and the attenuation effect is less significant. Besides, Point 3 is more close to Track No. 3, which means that the attenuation degree is less significant.
Fig. 11Comparison of beam vibrations on different floors
a) 1/3 octave RMS spectra of Point 2
b) 1/3 octave RMS spectra of Point 3
Fig. 12Influence of track position on beam vibration
a) 1/3 octave RMS spectra of point 2
b) 1/3 octave RMS spectra of point 3
3.4. Vibrations of beam-column joints
Fig. 13 shows the vibration response of beam-column joint on the second floor, taken from Point 4. The maximum acceleration is observed around 0.05 m/s2, which is nearly one third of the acceleration value at slab/beam midspan. It indicates that the columns provide rather large vertical stiffness, reducing the response of joint zones under train-induced vibration. On the other hand, the provided stiffness is not large enough so that it is not suitable to simplify the beam-column joints as fixed points when analyzing vibration of the floor system. It can be concluded from the frequency spectrum that predominant frequency occurs around 60 Hz, which is similar to the other points on the floor.
Fig. 13Vibration of beam-column joint on the second floor
a) Acceleration time-history
b) Frequency spectrum
c) 1/3 octave RMS spectra
Fig. 14Vibrations of beam-column joints in different stories
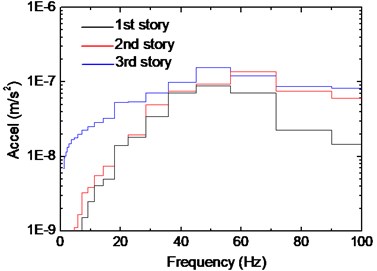
Fig. 15Influence of track positions on vibration of beam-column joint
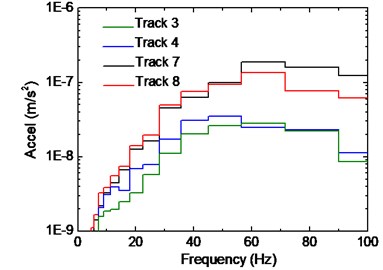
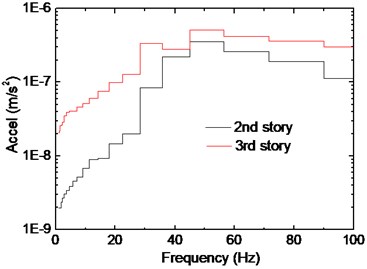
Fig. 14 shows the vibration response of beam-column joints on different floors. As compared with the third floor, amplitude of frequency below 30 Hz on the second floor has decreased significantly, while the contents beyond that range show little difference. On the other hand, when compared with the second floor, frequency amplitude above 50 Hz on the first floor has decreased significantly, while the other contents show little difference. It is worth noting that the amplitude around 50 Hz of the three curves is similar, which means that the bottom joints of the structure should not be simplified as the fixed points, i.e. the soil-structure interaction effect should be taken into consideration.
Fig. 15 presents the influence of track positions on response of beam-column joint. The trend is in general similar to that of the slab, which means that the larger distance to the track would induce smaller response. Note that the response caused by Track No. 7 is smaller than Track No. 8 in terms of frequency content above 60 Hz, and this is because measure Point 4 is more close to track 8, as shown in Fig. 2. Besides, compared with the spectra of the slab and beam, the predominant frequency of the beam column joint is not obvious in Fig. 14, especially for the response caused by Track No. 8.
4. Evaluation of vibration serviceability
Based on the measured data, the effect of train-induced vibration on human perception is evaluated in this section. In the engineering community, different indicators including the peak particle velocity [19], the RMS acceleration value [19, 20], the vibration velocity level () [21] and the weighted vibration severity [22] are commonly used for assessing the influence of vibration on inhabitants comfort. In this paper and are adopted for analysis.
4.1. RMS acceleration
The RMS acceleration describes the smoothed vibration amplitude by considering human response to different frequency bands during a recorded time , and is calculated as:
where denotes the frequency weighted time-history. However, the ISO2631-2 standard [20] does not provide guidance for the acceptable magnitude of aw, and the environmental vibration standard used in China [23] is adopted here as a reference, and the limit value of vibration level with respect to different sites is shown in Table 1. Note that the symbol represents the vertical direction vibration degree, which is calculated as:
where 10-6m/s2. Based on Eq. (3) and Eq. (4), the vertical vibration levels with respect to Points 1 to 6 are calculated, as shown in Table 2. Note that Table 2 shows the vibration data on the second floor except for Track 8, where the vibration levels of first and third floors are given as well. In general, the vibration level at beam-column join is smallest (i.e. Point 4), while the vibration level in a slab with a longer span is the biggest (i.e. Point 1). It can be concluded from the table that when the subway train moves on Track No. 3 or 4, the vibration level of all the measure point does not exceed the limit value in Table 1. When the train moves on Track No. 7 or 8, the vibration level for Point 1, 2 and 3 has greatly exceeded the limit value. Besides, when comparing the data at different floors, it can be seen that the vibration level on the first floor is significantly smaller than the other two floors, while the vibration level on the second floor is slightly smaller than that on the third floor. To conclude, when the train moves on a track which is just above the room in the two bottom floors, the train-induced vibration has reached to such an extent that the inhabitants in the room would feel discomfort, and mitigation measure is thus needed.
4.2. Vibration velocity level
Federal Transit Administration recommends the vibration velocity level as the indicator which is defined as:
where is the velocity level in decibels, is the RMS velocity amplitude of the vibration time history, and is the reference velocity amplitude which equals to 1×10⁻⁶ in/s (= 2.54×10⁻⁸ m/s). Based on Eq. (5) the vibration levels of measure points are illustrated in Table 3.
Table 1Limit value for VLz (dB) [23]
Area | Daytime | Night |
Residential and educational area | 70 | 67 |
Commercial area | 75 | 72 |
Industrial area | 75 | 72 |
Table 2Calculated VLz for the measure point (dB)
Track position | 1 | 2 | 3 | 4 | 5 | 6 | |
Track-3 | 2nd floor | 64 | 62 | 67 | 52 | 59 | 60 |
Track-4 | 64 | 61 | 67 | 53 | 57 | 58 | |
Track-7 | 76 | 75 | 72 | 64 | 66 | 64 | |
Track-8 | 1st floor | 62 | N.A. | N.A. | 61 | N.A. | N.A. |
2nd floor | 76 | 76 | 71 | 66 | 68 | 63 | |
3rd floor | 76 | 75 | 77 | 66 | 70 | 65 | |
Note: N.A. =Not Available | |||||||
Table 3Calculated Lv for different measure points (dB)
Track position | 1 | 2 | 3 | 4 | 5 | 6 | |
Track-3 | 2nd floor | 100 | 95 | 101 | 87 | 92 | 94 |
Track-4 | 100 | 95 | 102 | 90 | 92 | 93 | |
Track-7 | 109 | 108 | 106 | 98 | 99 | 98 | |
Track-8 | 1st floor | 100 | N.A. | N.A. | 95 | N.A. | N.A. |
2nd floor | 110 | 109 | 105 | 99 | 101 | 96 | |
3rd floor | 116 | 111 | 121 | 112 | 113 | 110 | |
Note: N.A. =Not Available | |||||||
Besides, the standard indicates that velocity level exceeding 80 dB would cause residential annoyance. As a result, the vibration levels of all measure points have exceeded the threshold value. The vibration problem evaluated using turns out to be more serious than the result evaluated using , and this can be explained by that considers frequency weighing in calculating the vibration level.
In general, both the two indicators (i.e. and) show that vibration level of the points closer to the track is higher; however, the two indicators present different tendencies as the distance to the train increases. For , a larger decrease in the horizontal direction (Track-7 and Track-4) and a smaller reduction in the vertical direction (the 3rd floor and 2nd floor of Track-8) can be observed from Table 1, as the distance to the train increases; while for the tendency is just opposite. Besides, inconsistent evaluation results may be obtained using different criteria. For example, vibration at Track-3 is acceptable with regards to , while it is considered to be excessive when is used.
5. Possible solution to vibration problem
In this section, numeric simulation is conducted to investigate the influence of the train-track system and the building structure on floor vibrations, so as to provide some references to the vibration control.
5.1. Influence of train-track system
As shown in Fig. 16, the train is modeled as a multi-body system with 10 degrees of freedom, and the track is modeled as a finite Euler beam supported on the massless fasteners. The connection between the wheel and the rail is modeled through the compression-only spring with the Hertz contact theory. The fastener force, which acts on the floor, is expressed as:
where denotes the vertical displacement at the th fastener. According to the procedure proposed by Lei and Noda [2], the force time history and the frequency spectrum are shown in Fig. 17.
Fig. 16Numeric model of the train-track system
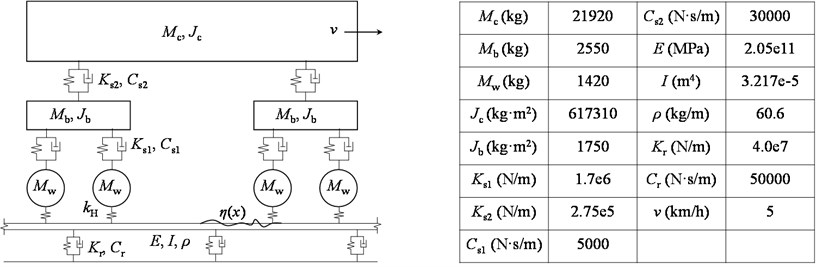
Fig. 17Time- and frequency-domain responses of fastener force
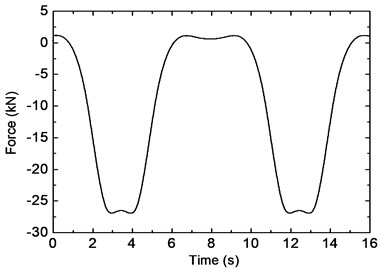
a) Time history
b) Frequency spectrum
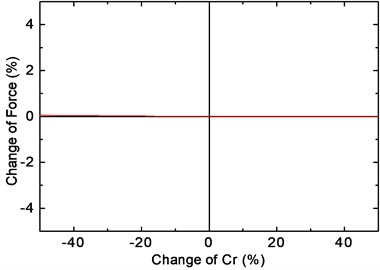
Figs. 18 and 19 show the change of the maximum value of fastener force with respect to the change of fastener stiffness and damping , respectively. It can be seen from the figures that the force value decreases slightly as decreases, while the change of the force is insignificant as increases or decreases. As a result, it is inefficient to control the train-induced vibrations by reducing the stiffness or increasing the damping of the fastener, especially when the train runs at a low speed. Moreover, a sharp increase in vertical displacements could be observed as is reduced, which may result in an unsafe condition of the train.
Fig. 18Influence of Kr on the fastener response
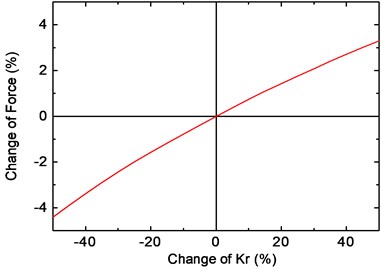
a) Change of fastener force
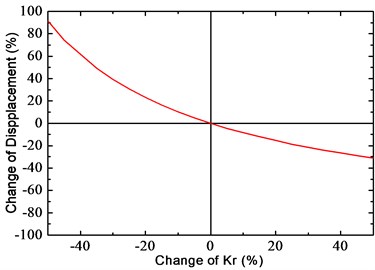
b) Change of fastener displacement
Fig. 19Influence of Cr on the fastener force
5.2. Influence of building structure
A two-dimensional (2D) frame taken from the depot structure is used for parametric analysis to seek for the vibration mitigation method, as shown in Fig. 20. The driving point A, which is located at the position of Track 8, is subjected to a unit force with constant amplitude in the frequency domain. Acceleration response of the test point B, is selected for evaluating the mitigation effect. Assuming that the beams and columns are subjected to axial and bending deformation only, the dynamic response of the beam can be expressed as:
where denotes the vibration frequency, and denote the axial and bending deformations of the beam (column), respectively. Based on Eqs. (7) and (8), the nodal force and nodal displacement of a beam element can be expressed as:
where is the dynamic stiffness of the beam element [24].
According to the research done by Sanayei et al. [12], the slab is assumed to be infinite and its driving point impedance is:
where is the slab thickness and is Poisson ratio, while the loss facotr is selected as 0.01 for concrete structure [25]. Based on Eqs. (9) and (10), dynamic stiffness of the frame structure can be calculated and acceleration response of point B can thus be obtained.
Fig. 20Configuration of the 2D frame
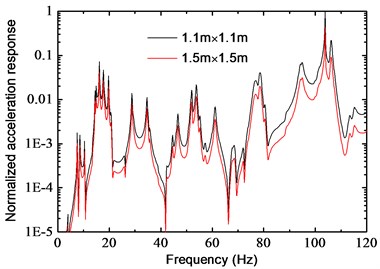
Fig. 21Influence of building parameters on frequency response (Point B)
a) Thickness of the 2nd floor
b) Thickness of the 1st floor
c) Section of bottom column
Fig. 21 shows the normalized frequency response function (FRF) of point B, where the influence of slab thickness and column dimension on vibrations can be observed. Little difference of the FRFs can be found in Fig. 21(a), when slab thickness of the 2nd floor increases from 150 mm to 300 mm. This conclusion is different from the “blocking floor theory” proposed by Sanayei et al. [12], which may be partly due to the fact that slab-to-column impedance ratio of this model is very small (about 0.044), and this value changes little by increasing the slab thickness. On the other hand, the mitigation effect is significant as the slab thickness of the 1st floor (where point B locates) increases, as shown in Fig. 21(b). The influence of column section dimension is shown in Fig. 21(c), where the columns in the 1st story increase from 1.1 m×1.1 m to 1.3 m×1.3 m. By increasing axial stiffness of these columns, the vibration waves are more likely to be “reflected” at the top of columns in first story, so that vibration energy transmitted to the floor may be reduced. Unlike the test data, the main frequency in Fig. 21 does not locate around 50 Hz as expected, which is considered as a result of the difference between 2D model and real structure, and an improved prediction model might be needed in future study for more accurate analysis.
6. Conclusions
This paper presents an in-situ vibration test of a metro depot aiming to study the response of the building subjected to moving subway trains on the inner floor. Acceleration time histories of the floor system are measured, and the corresponding frequency spectra as well as the 1/3 octave band RMS spectra are calculated and discussed. Comparisons with respect to position of the measure points and railway tracks are given, and vibration level of the building is evaluated using different indicators. Based on the above work, the following conclusions can be made:
1) Acceleration time history of the rail is characterized by a series of peaks which are considered as a result of impact between the wheel and rail joints. Predominant frequency and vibration energy of the rail are observed around 800 Hz. The response of midspan point appears to be smaller than that of the point closer to the sleeper, and this is thought to be due to the imperfect contact between the rail and the sleeper.
2) Compared with horizontal vibration, vibration response of the slab in the vertical direction is much larger and is the emphasis in vibration evaluation. Predominant frequency and vibration energy of the slab have been observed around 60 Hz, which is also the case for the frame beam and beam-column joint. Compared with the second and third floors, vibration response on the foundation slab is smaller, yet could not be neglected, which means that the soil-structure interaction effect should be taken into consideration.
3) In general, the distance between the railway track and measure point does have an obvious influence on vibration response. Vibration amplitude decreases significantly as the distance increases, while the predominant frequency keeps unchanged. Besides, the amplitude decreases more quickly for the beam perpendicular to the track, and this is partly due to the existence of frame columns that has prevented the propagation of vibration wave.
4) Different indicators including the RMS acceleration value and weighted vibration velocity level have been adopted for evaluating vibration level of the depot. Even though the train speed is as low as 5km/h, the analytical data show that vibration level of the office on the second floor have exceeds the limit value when the subway train moves in/out on the third floor, and this case is especially obvious when the track locates just above the office. As a result, the inhabitants would feel discomfort when subjected to the train-induced vibration, and mitigation measure is needed.
5) According to the numeric analysis, it is inefficient to control the train-induced vibration by reducing the stiffness or increasing the damping of the fasteners, especially when the train runs under a low speed. On the other hand, a good mitigation effect may be obtained by increasing the slab thickness of the working floor and/or enlarging the cross-section of columns in the first story.
References
-
Connoll D. P., Mareck G. P., Kouroussis G., Thalassinakis I., Woodward P. K. The growth of railway ground vibration problems – a review. Science of the Total Environment, http://dx.doi.org/10.1016/j.scitotenv.2015.09.101, 2015.
-
Lei X., Noda N. A. Analyses of dynamic response of vehicle and track coupling system with random irregularity of track vertical profile. Journal of Sound and Vibration, Vol. 258, Issue 1, 2002, p. 147-165.
-
Lombaert G., Conte J. P. Random vibration analysis of dynamic vehicle-bridge interaction due to road unevenness. Journal of Engineering Mechanics, Vol. 138, Issue 7, 2011, p. 816-825.
-
Zhang J., Gao Q., Tan S. J., Zhong W. X. A precise integration method for solving coupled vehicle-track dynamics with nonlinear wheel-rail contact. Journal of Sound and Vibration, Vol. 331, Issue 21, 2012, p. 4763-4773.
-
Zeng Z. P., Zhao Y. G., Xu W. Y., Yu Z. W., Chen L. K., Lou P. Random vibration analysis of train-bridge under track irregularities and traveling seismic waves using train-slab track-bridge interaction model. Journal of Sound and Vibration, Vol. 342, 2015, p. 22-43.
-
Zougari A., Martinez J., Cardona S. Numerical models of railway tracks for obtaining frequency response comparison with analytical results and experimental measurements. Journal of Vibroengineering, Vol. 18, Issue 2, 2016, p. 1104-1114.
-
François S., Schevenels M., Galvín P., Lombaert G., Degrande G. A 2.5 D coupled FE-BE methodology for the dynamic interaction between longitudinally invariant structures and a layered halfspace. Computer Methods in Applied Mechanics and Engineering, Vol. 199, Issue 23, 2010, p. 536-1548.
-
Verbraken H., Lombaert G., Degrande G. Verification of an empirical prediction method for railway induced vibrations by means of numerical simulations. Journal of Sound and Vibration, Vol. 330, Issue 8, 2011, p. 1692-1703.
-
Kouroussis G., Connolly D. P., Olivier B., Laghrouche O., Costa P. A. Railway cuttings and embankments: experimental and numerical studies of ground vibration. Science of the Total Environment, Vol. 557, 2016, p. 110-122.
-
Amado-Mendes P., Costa P. A., Godinho L. M. C., Lopes P. 2.5 D MFS-FEM model for the prediction of vibrations due to underground railway traffic. Engineering Structures, Vol. 104, 2015, p. 141-154.
-
Fiala P., Degrande G., Augusztinovicz F. Numerical modelling of ground-borne noise and vibration in buildings due to surface rail traffic. Journal of Sound and Vibration, Vol. 301, 3, p. 718-738.
-
Sanayei M., Zhao N., Maurya P., Moore J., Zapfe J., Hines E. Prediction and mitigation of building floor vibrations using a blocking floor. Journal of Structural Engineering, Vol. 138, Issue 10, 2012, p. 1181-1192.
-
Lopes P., Ruiz J. F., Costa P. A., Rodriguez L. M., Cardoso A. S. Vibrations inside buildings due to subway railway traffic. Experimental validation of a comprehensive prediction model. Science of the Total Environment, http://dx.doi.org/10.1016/j.scitotenv.2015.11.016, 2015.
-
Zhou H., He W., Xie W. Research on vibration serviceability of over-track buildings. ICTIS Improving Multimodal Transportation Systems-Information, Safety, and Integration, Wuhan, China, 2013, p. 621-626.
-
Sanayei M., Maurya P., Moore J. A. Measurement of building foundation and ground-borne vibrations due to surface trains and subways. Engineering Structures, Vol. 53, 2013, p. 102-111.
-
Sanayei M., Moore J. A., Brett C. R. Measurement and prediction of train-induced vibrations in a full-scale building. Engineering Structures, Vol. 77, 2014, p. 119-128.
-
Zou C., Wang Y., Wang P., Guo J. Measurement of ground and nearby building vibration and noise induced by trains in a metro depot. Science of the Total Environment, Vol. 536, 2015, p. 761-773.
-
Hou B., Gao L., Xin T., Cai X. Prediction of structural vibrations using a coupled vehicle-track-building model. Proceedings of the Institution of Mechanical Engineers, Part F: Journal of Rail and Rapid Transit, Vol. 230, Issue 2, 2016, p. 510-530.
-
ISO 2631-1: Mechanical Vibration and Shock-Evaluation of Human Exposure to Whole-Body Vibration. Part 1: General Requirements. International Organization for Standardization, 1997
-
ISO 2631-2: Mechanical Vibration and Shock-Evaluation of Human Exposure to Whole-Body Vibration. Part 2: Vibration in Buildings (1 Hz to 80 Hz). International Organization for Standardization, 2003.
-
Hanson C. E., Towers D. A., Meister L. D. Transit Noise and Vibration Impact Assessment. Report FTA-VA-90-1003-06, U.S. Department of Transportation, Federal Transit Administration, Office of Planning and Environment, 2006
-
DIN 4150-2: Structural Vibrations. Part 2: Human Exposure to Vibration in Buildings. Deutsches Institut für Normung, 1999.
-
GB10070-88, Standard of Environmental Vibration in Urban Area. China, 1989, (in Chinese).
-
Lee U. Spectral Element Method in Structural Dynamics. John Wiley and Sons, 2009.
-
Cremer L., Heckl M. Structure-Borne Sound: Structural Vibrations and Sound Radiation at Audio Frequencies. Springer Science and Business Media, 2013.
Cited by
About this article

The research described in this paper was financially supported by the National Science Foundation of China under Grant No. 51278106, the Open Foundation of National Engineering Laboratory for High Speed Railway Construction under Grant No. HSR2013029, and the Priority Academic Program Development of Jiangsu Higher Education Institutions under Grant No. CE02-1-8.
