Abstract
Pounding phenomenon between base-isolated structures under near-fault earthquakes has been widely investigated with various impact models around the world. Firstly, the existing impact analysis models are summarized and discussed in this paper. For the Hertz-damp impact model, the damping constant does not coincide with its physical fact. Then, the damping constant in the Hertz-damp impact analysis model was modified based on the Hertz theory. Next, the approximate formula of the damping constant is theoretically derived, and the effectiveness is verified by a simulation analysis. The numerical results show that the pounding can significantly increase the floor acceleration, especially at the isolation layer. In addition, the impact stiffness has a significant effect on the acceleration response, and the inter-story drifts are also sensitive to the variety of impact stiffness. The simulation results indicate that excessive flexibility at the base-isolated system may lead to a susceptible pounding with a limited seismic gap.
1. Introduction
Structural pounding is a complicated nonlinear problem. In order to effectively investigate the impact response of adjacent structures, it is essential to establish a reasonable impact analysis model. In the past decades, some scholars have proposed a series of impact models. The Kelvin model is often used to simulate the collision with the adjacent structure, but the demerit of the Kelvin model is that the damping coefficient in the expression is constant. Therefore, Ye et al. [1] modified the expression of the damping coefficient in the Kelvin model. These impact models described above are linear ones, and the demerit of these models is that the viscous damping coefficient is constant during the whole impact. This will lead to a uniform variation in the energy loss at the impact start and rebound process. In order to simulate the relationship between force and displacement during the process of collision, many investigators proposed nonlinear impact models. Jankowski [2] proposed a nonlinear viscoelastic model based on Hertz impact model, and derived the expression of the damping constant. The efficiency of the model is verified by a series of numerical simulations. Due to Hertz model without considering the energy loss, Muthukumar [3] proposed a Hertz-damp model and verified its effectiveness by comparing with other impact models.
During some near-fault earthquakes, there are pounding problems between adjacent structures, which will lead to significant casualties and property losses. During the Mexico earthquake, more than 40 % buildings collapsed due to structural poundings. During other earthquakes, such as the 1994 Northridge earthquake, 1995 Kobe earthquake, 1999 Turkey earthquake, 2000 Chi-Chi earthquake and 2008 Wenchuan earthquake [4, 5], pounding phenomena have also been observed. The structural pounding has been demonstrated to be an important factor that affected the seismic response and the seismic performance of the structure. With the increase of building density, the structure collision has become one of the important research topics in earthquake disaster prevention and mitigation engineering.
The base-isolation technology has been widely used to enhance the performance of the architectural structure in the past decades. This method can extend the natural vibration period of the structural system, and suppress the acceleration response of the structure with appropriate damping. However, during strong earthquakes, especially in most near-fault earthquakes, the horizontal displacement of the isolation layer became much larger. When the gap of the adjacent buildings is relatively small, the structural pounding will take place. Pounding will not only affect the structure damage degree, but also lead to secondary damage. Many researchers have done a lot of investigations on the structural pounding. Nagarajaiah et al. [6] investigated the collision problems of a base-isolated building during the Northridge earthquake. Matsagar et al. [7] investigated impact models of different types for seismic isolation structures with adjacent structures under earthquakes. The results show that the isolation effectiveness is greatly affected by the pounding of the base-isolated structure and adjacent structures. Polycarpou et al. [8] investigated the collision problem of the base-isolation structure and the adjacent non-base-isolation structure. Panayiotis et al. [9] investigated the pounding of the base-isolated structure and the adjacent structure under different seismic waves. It is concluded that the pounding response of the base-isolated structure and adjacent structure is mainly determined by the dynamic characteristics of the structure and seismic waves. Utilizing the nonlinear Hertz-damp model of the contact element method, Zhao et al. [10] investigated the dynamic equations of the pounding between a base-isolated structure and non-isolated structure. The results show that the acceleration responses of the base-isolated structure are amplified when the pounding happens. Huang et al. [11] investigated the impact of adjacent structures under near-fault ground motions. Zou et al. [12] analyzes the impact problem of the adjacent base-isolated structure with pre-stressed rubber bearing, and the results show that the horizontal displacement of the base-isolated structure can be effectively reduced by ordinary rubber bearing.
In this paper, based on the reviews of impact models, a modified Hertz-damp model is proposed. According to the existing pounding tests, a series of numerical simulations are conducted by MATLAB/Simulink software. The crash simulation results are compared and analyzed with the other impact models to verify the correctness and accuracy of the modified Hertz-damp model. Meanwhile, the impact action on the effectiveness of a base-isolated structure is also investigated. A series of parameters for an analysis, including the isolation period, initial gap size and type of earthquake, yielding displacement, number of story, and impact stiffness, are implemented to investigate the effectiveness of the base-isolated structure under near-fault earthquakes.
2. Reviews of existing impact model
The classical dynamic analytical and contact element methods are two main methods for the analysis of structural impact. For the numerical analysis of pounding problem, the classical dynamics method is not very convenient and rarely used. The contact element method has been widely used with some merits for creating a mathematical model of impact force for the structural impact analysis. The merits of this method are easy addition of a contact element to the impact position, which consists of an equivalent spring element and equivalent damper element. During the structural impact interaction and energy dissipation, the unit will be merged at the time of impact occurrence.
Fig. 1Analysis model of structural pounding
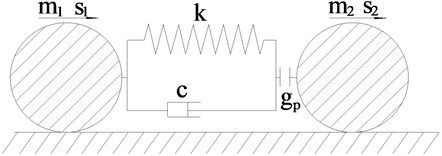
The analysis model of structural pounding is shown in Fig. 1. In the figure, and are the masses of two colliding spheres respectively; and are the displacements of two colliding spheres, respectively; and are velocities at the initial moment of contact, respectively; and are the velocities of the colliding spheres after impact, respectively; is the damping coefficient; is the initial clearance of the colliding spheres; is the stiffness coefficient of impact contact element.
2.1. Linear elastic model
The linear elastic model [13] is the simplest collision analysis model. The mathematical expression of this impact force can be expressed as:
where stands for the impact spring stiffness, expresses the relative displacement of two colliding objects.
This model does not include the energy loss during the process of pounding, and the impact force is proportional to the relative displacement.
2.2. Kelvin model
The loss of energy in Kelvin model [14] is illustrated by linear viscous damping. The impact force is expressed as:
where denotes the relative displacement of two colliding objects, denotes the relative velocity of the colliding objects during the impact process, denotes the Kelvin model impact spring stiffness, denotes the damping coefficient.
The damping coefficient can be determined by the following equation:
where and denote the masses of the colliding objects, respectively, denotes the damping ratio, which is related to the recovery coefficient . The expression of the damping ratio in the formula can be expressed as:
The demerit of linear elastic impact models is that the viscous damping coefficient is constant during the whole impact. This will lead to a uniform variation in energy loss at the impact start and rebound process. Meanwhile, the Kelvin model will cause the impact force to make the pulling force appear at the impact beginning and to make a leap emerge at the impact rebound, which is not consistent with the actual pounding phenomena.
2.3. Hertz model
In the impact process, the increase of the impact force is nonlinear. In order to simulate the impact process more accurately, many scholars have proposed some impact force models based on the Hertz theory. The impact force based on Hertz theory is expressed as:
where denotes the relative displacement of two colliding objects, denotes the impact stiffness of Hertz model [15].
2.4. Hertz-damp model
The Hertz-damp model [16] makes up the deficiency of the Hertz model, which does not take a consideration on the energy loss, and adds the nonlinear damping term in this model. The relationship between the impact relative displacement and the impact force is expressed as:
where denotes the relative displacement of two colliding objects, denotes the relative velocity of the colliding objects during the impact process, denotes the impact stiffness of the Hertz-damp model, denotes the damping coefficient.
The damping coefficient can be expressed as:
The damping constant is related to the nonlinear stiffness , the coefficient of restitution and the relative initial velocity of the structure pounding , which can be expressed as:
In the nonlinear viscoelastic model, indicates that the impact is completely elastic, and indicates that the impact is completely plastic [17]. Through Eq. (8), it can be found that , is consistent with the elastic impact perfectly. However, is not consistent with the full plastic impact. Therefore, the Hertz-damp model has some errors for the pounding simulation.
2.5. Non-linear viscoelastic model
Many previous collision tests have shown that the pounding process could be divided into the approach period and the restitution period. Cracking, crushing and plastic deformation in the process of collision mainly occurred during the approach period. The energy loss mainly happened in this stage. Therefore, Jankowski proposed the modified Hertz-damp model. In this non-linear viscoelastic model [17], the formula of the pounding force is expressed as:
where denotes the relative displacement of two colliding objects, denotes the relative deformation velocity of the colliding objects during the impact process, denotes impact stiffness, denotes the damping coefficient.
The damping coefficient can be determined by the following equation:
The relation between the damping constant and the coefficient of restitution is expressed as:
However, for the non-linear viscoelastic model, the time history curve of the impact force is not smooth. Therefore, the damping constant should be further optimized.
3. Modified Hertz-damp model and numerical verification
3.1. Modified Hertz-damp model
According to classical mechanic’s theory, the energy loss induced by the collision can be expressed as [18]:
According to the classical theory of impact, the coefficient of restitution can be acquired by the following equation:
At the same time, the energy loss during the collision induced by the damping force can be expressed as:
The two-degrees-of-freedom system, as shown in Fig. 1, can be equivalent to a single-degree-of-freedom system, which can be converted into initial intrusion displacement and initial intrusion velocity, that is . In this system, the equation of motion of the equivalent model can be derived as:
where is the equivalent mass of the single-degree-of-freedom system.
The analytical solution of the above equation is not easy to be solved. Here, we employ a simple iterative method to solve this problem. Using to replace [19], can be rewritten as:
Substituting Eq. (16) into Eq. (15), the Eq. (15) can be rewritten as:
Here, we employ the traditional separation of variables. Based on the Hertz contact theory, the damping influence will be ignored. After an integral on the Eq. (17), the following equation can be obtained:
where denotes the intrusion velocity, denotes the intrusion velocity at the moment of collision separation, and denotes the intrusion displacement.
By conversion formula, the displacement deformation can be expressed as:
The maximum deformation can be indicated as:
According to Eq. (19) and Eq. (20), the relation between and can be expressed as:
Based on Eq. (21), the relative velocity at the restitution period can be expressed as:
where is the relative velocity of two objects at the time of separation.
Substituting Eq. (22) into Eq. (14), the energy loss can be expressed as:
The evaluation of the integral of Eq. (23) can be acquired in the reference [20]. This method can be used to solve the following equation:
Combing Eq. (24) and Eq. (12), it can be obtained as the following equation:
Substituting Eq. (20) into Eq. (25), the following equation can be obtained as:
The expression of improved damping constant can be obtained as:
3.2. Numerical verification of formula for damping constant
In order to further verify the correctness of the approximate formula of the damping constant, a collision model between a pendulum and static rigid wall [21] is shown in Fig. 2. The following parameters 570 kg, 0.7 m, 2×10⁹ N/m3/2 and initial impact velocity 0.5 m/s are used in the formula.
Fig. 2Model of pendulum ball striking rigid barrier
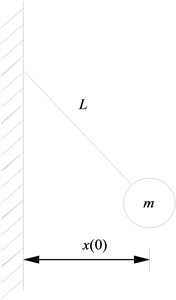
Table 1Relative error of recovery coefficient under collision between pendulum and static rigid wall
Model of this paper | Non-linear viscoelastic model | Hertz-damp model | ||||
Error (%) | Error (%) | Error (%) | ||||
0.1 | 0.0738 | 26.2 | 0.0688 | 31.2 | 0.6604 | 560.4 |
0.2 | 0.1644 | 17.8 | 0.1550 | 22.5 | 0.6698 | 234.9 |
0.3 | 0.2696 | 10.1 | 0.2557 | 14.8 | 0.6835 | 127.8 |
0.4 | 0.3785 | 5.3 | 0.3622 | 9.5 | 0.7015 | 75.4 |
0.5 | 0.4857 | 2.9 | 0.4692 | 6.2 | 0.7250 | 45.0 |
0.6 | 0.5921 | 1.3 | 0.5769 | 3.9 | 0.7553 | 25.9 |
0.7 | 0.6949 | 0.7 | 0.6826 | 2.5 | 0.7955 | 13.6 |
0.8 | 0.7976 | 0.3 | 0.7869 | 1.6 | 0.8481 | 6.0 |
0.9 | 0.9000 | 0.0 | 0.8948 | 0.6 | 0.9137 | 1.5 |
1.0 | 1.0000 | 0.0 | 1.0000 | 0.0 | 1.0000 | 0.0 |
The equation of motion for this model can be expressed as:
where denotes the mass of the pendulum striker, and denote the horizontal acceleration and horizontal displacement of the pendulum striker, respectively, denotes the length of the pendulum striker, denotes the acceleration of gravity; denotes the impact force, which is calculated by Eq. (6).
In Eq. (6), the deformation can be expressed as:
Simulation results of three different impact models and relative error percentages of recovery coefficient at different initial values are listed in Table 1. As it can be seen from the table, the impact model of this paper has much higher simulation precision than the modified Hertz-damp model and Hertz-damp model. Meanwhile, the relative error decreases with the increase of the initial value . When the initial value of the coefficient of restitution is greater than 0.5, the relative error is less than 1.5 %. During the collision of the actual engineering structure, the recovery coefficient is generally at the range of 0.5-0.75 [18].
The existing structural impact analysis models are summarized, and the merits and demerits among them are discussed. And, the modified Hertz-damp model is theoretically deduced based on the Hertz theory. The accuracy and effectiveness of the modified model is verified by a series of numerical simulations. Therefore, it can be concluded that reliable results of impact simulation can be provided by using modified Hertz-damp model.
4. Numerical analysis of base-isolated structural pounding
4.1. Model of base-isolated structure
The pounding of adjacent base-isolated structures is investigated in this section. The impact model of the base-isolated structure with a lead-rubber bearing (LRB) device is shown in Fig. 3. It is assumed that the mass of the structure is concentrated at the floor. The floor is rigid in its own plane, without consideration of the vertical deformation of the superstructure and isolation bearing.
The equation of motion for the structural impact under earthquake can be expressed as:
where , and denote the mass, damping and stiffness matrices of the superstructure, respectively, , and denote the horizontal relative acceleration, velocity and displacement vector of the base-isolated structure, respectively, denotes the relative acceleration of isolation layer, denotes the corresponding ground motion acceleration, denotes the unit column vector. The mass, damping and stiffness matrices of the structure are expressed as follows:
The corresponding equation of motion for the isolation layer under near-fault earthquake motion is expressed as:
where and denote the mass, and restoring force in the LRB isolation system, respectively, and denote the stiffness and damping of the first floor, respectively.
The pounding will occur when the absolute displacement of the base exceeds the isolation gap distance. The differential equation for the isolation layer during pounding is expressed as:
where and denote the absolute value of the pounding force and the sign function, respectively.
The stiffness and damping of the base-isolated system are selected to provide the specific values of two parameters, which are named the isolation time-period and damping ratio , respectively. They are expressed as:
where denotes the total mass of the isolated structure, denotes the mass of floor, and denotes the isolation frequency.
Fig. 3Impact model of adjacent base-isolated system
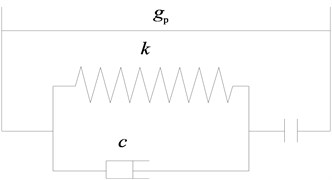
a) Impact element
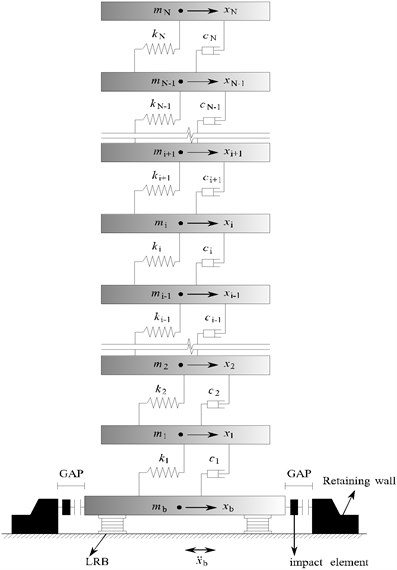
b) Mathematical model of based-isolated structure
4.2. Numerical simulations and analysis
In this section, a five-story base-isolated structure is taken as an analytical model [22]. The characteristics of each story are as follows. The mass of each floor of the superstructure is 5×10⁵ kg, the pre-yield stiffness of each floor is 1×10⁹ N/m, and the post-yield stiffness is 2×10⁷ N/m. The LRB mechanism is installed at the isolation layer. The mass of base isolation layer is 5.5×10⁵ kg, the post-yield stiffness is 1.93×10⁶ N/m, the yield strength is 1.93×10⁶kN, and the yield displacement is 0.01 m. The damping of the superstructure is assumed to be the Rayleigh damping. The first two damping ratios are assumed to be 0.05. The fundamental periods of the structure without and with LRB are 0.494 s and 2.5 s, respectively.
To investigate the base-isolated structural impact response, the parameter for different impact models is very important. The values of the parameter in different impact model are described as:
(1) The impact stiffness in the linear elastic model is 5.8×10⁸ N/m.
(2) The impact stiffness and damping constant in the Kelvin model are equal to 5.8×10⁸ N/m and 0.14, respectively.
(3) In the Hertz model, the value of the impact stiffness is 2.95×10⁹ N/m1.5.
(4) The value of the impact stiffness in the Hertz-damp model is 2.95×10⁹ N/m1.5.
(5) The values of the impact stiffness and the coefficient of restitution in the modified Hertz-damp model are the same as those in the Hertz-damp model.
Table 2Comparison of peak response for different impact models
Peak responses | Linear elastic model | Hertz model | Kelvin model | Hertz-damp model | Modified Hertz-damp model |
Base floor displacement (cm) | 11.04 | 10.83 | 10.76 | 10.55 | 10.41 |
Top floor displacement (cm) | 14.17 | 13.92 | 13.86 | 13.70 | 13.55 |
Base shear force (kN) | 48843.7 | 48395.3 | 47956.8 | 48039.5 | 47560.1 |
Base floor acceleration (m/s2) | 20.81 | 20.45 | 19.96 | 19.72 | 19.87 |
Top floor acceleration (m/s2) | 14.77 | 14.69 | 14.35 | 14.10 | 14.02 |
The Kocaeli earthquake with Peak Ground Acceleration (PGA) of 0.4 g is employed as the input seismic excitation. Using MATLAB/Simulink, the earthquake response time history of the structure system with and without consideration of the pounding is obtained. The peak responses of a base-isolated structure with a 10 cm separation gap under various different impact models are listed in Table 2. From the table, it can be found that the differences are within 10 % for different impact models. However, with the increase of the collision energy, the error of the pounding simulation will increase. Therefore, it is necessary to employ the nonlinear impact model in the practical engineering. It also can be found that the modified Hertz-damp model is more accurate than the other models, and closer to the physical reality of the pounding. So, the simulation result of the modified Hertz-damp impact model is reliable.
The time histories of the top floor acceleration for the fixed-supported and base-isolated structures with and without impact are plotted in Fig. 4(a). From the figure, it can be seen that the accelerations of the base-isolated structure may remarkably increase due to poundings when the seismic gap is excessive. The time histories of the impact force and base shear force for the base-isolated building with impact are also plotted in Fig. 4(b) and Fig. 4(c), respectively. From the figure, it can be seen that the peak acceleration of the top floor at the time of pounding is almost similar to that of the fixed-supported structure. The effects of poundings are remarkable, especially on the acceleration response of the base level where impacts occur.
The peak inter-story drifts and absolute accelerations of the structure for different cases are shown in Fig. 5(a) and Fig. 5(b), respectively. Here, we employ two different widths of seismic gap, which equal to 5 cm and 10 cm, respectively. These results are also compared with the fixed-supported and base-isolated buildings without impact. It can be seen from the figures that; the floor accelerations and the inter-story drifts of base-isolated structures increase at the top floor while comparing with base-isolated building without impact and with the fixed-supported structure. The influence of pounding for the lower floors is more obvious than that for the upper structure.
Fig. 4Responses of base-isolated structure under earthquake
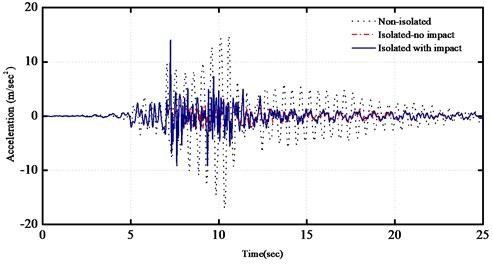
a) Comparisons on time history of the top floor accelerations
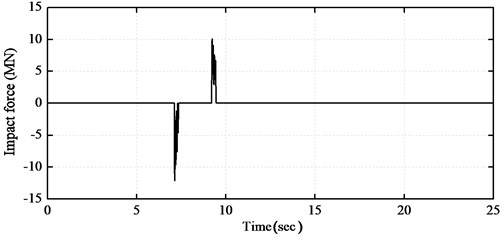
b) Time history of impact force with 10 cm gap
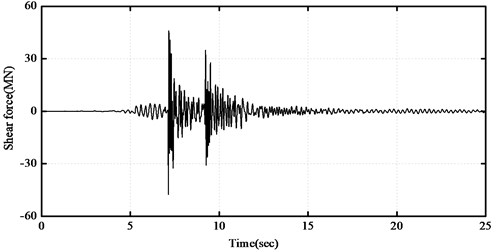
c) Time history of shear force with 10 cm gap
4.3. Influence factors analysis
There are many parameters that affect the dynamic performance of pounding between adjacent structures. In this section, the influences of the initial gap, impact stiffness, number of story, isolation period and yielding displacement on the impact of the structure are fully analyzed. A five-story building structure with LRB isolation mechanism is employed for the parametric analysis. The above parameters are varied in order to investigate the effectiveness of seismic isolation during pounding. For the case of pounding, the modified Hertz-damp model is employed. Here, the coefficient of restitution is 0.65, and the impact stiffness equals to 2.95×10⁹ N/m1.5.
The MATLAB software is used to establish the numerical simulation models and parametric analyses [23]. Four selected near-fault earthquake records, which are listed in Table 3, are used to investigate the effectiveness of the above parameters on the seismic response of the base-isolated building during poundings. The peak value of ground acceleration of each earthquake record is scaled to 0.4 g. The acceleration spectra of the selected near-fault earthquakes with the damping ratio 5 % are shown in Fig. 6.
Fig. 5Comparisons on peak responses under earthquake
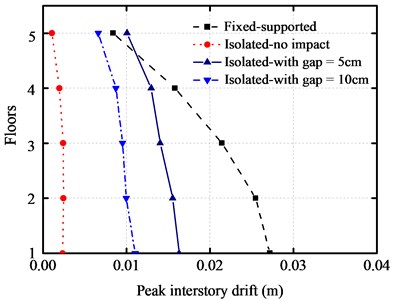
a) Comparisons on peak inter-story drifts
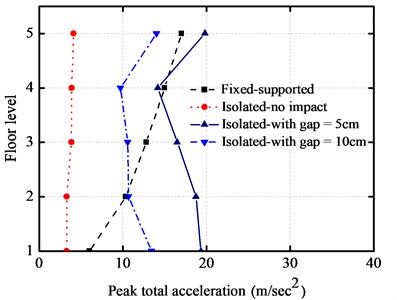
b) Comparisons on peak absolute accelerations
Fig. 6Response spectra for selected near-fault seismic records with damping ratio 0.05
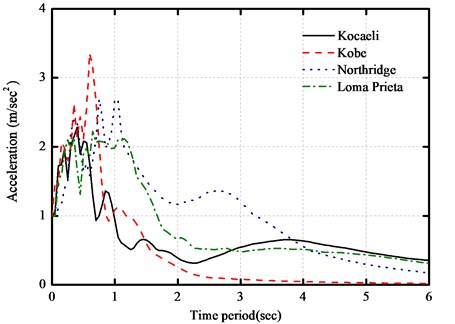
Table 3Characteristics of selected near-fault earthquakes
Earthquake | Station | PGA (g) | Distance (km) | PGV/PGA | |
Kocaeli 1999 | 7.4 | Gebze | 0.244 | 17 | 0.21 |
Kobe 1995 | 6.9 | Kobe University | 0.276 | 0.9 | 0.204 |
Northridge 1994 | 6.7 | Administrative Building | 0.441 | 5.4 | 0.277 |
Loma Prieta 1989 | 7.0 | Saratoga-W Valley Coll | 0.232 | 8.4 | 0.204 |
4.3.1. Effect of isolation period
In order to investigate the effect of isolation period of the LRB isolation system, the peak responses of the absolute accelerations, inter-story drifts, impact force and base shear force are obtained for a five-story base-isolated structure under the impact of the above earthquakes, as shown in Fig. 7. The isolation period varies from 1.5 s to 4.5 s, and the isolation gap equals to 10 cm. It can be seen from the figures that the peak absolute accelerations have not notable changes with the increase of period of LRB isolation system. In addition, the peak inter-story drifts increase to a certain value at the initial stage, and then keep almost constant with the increase of fundamental period of LRB isolation system. This implies that the increase of the isolation period is almost insensitive to the behavior of base-isolated buildings during the pounding process. The peak impact force and base shear force of base-isolated structure decrease with the increase of isolation period under different near-fault earthquakes.
Fig. 7Isolation period versus peak responses of base-isolated structure with 10 cm gap
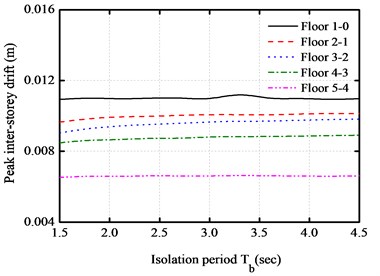
a) Peak inter-story drifts
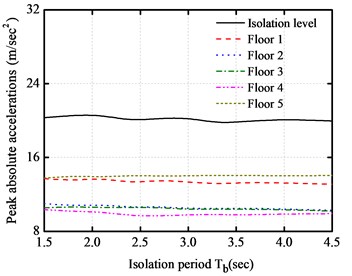
b) Peak absolute accelerations
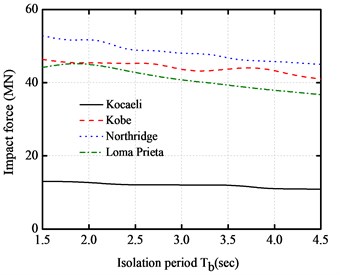
c) Peak impact forces
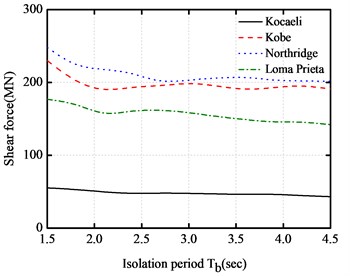
d) Maximum shear forces
4.3.2. Effect of yielding displacement
The peak absolute floor accelerations, peak inter-story drifts, peak impact force and peak base shear force with different yielding displacement are plotted under different near-fault earthquakes for the above base-isolated structure, as shown in Fig. 8. The yielding displacement varies from 0.5 cm to 4.5 cm.
It can be seen from the figures that the peak absolute floor accelerations and peak inter-story drifts decrease as the yielding displacement increases, and then reaches a minimum level at the vicinity of 1.5 cm. The peak impact force and peak base shear force are intensive with the increase of yielding displacement. Similarly, they also firstly decrease and then increase. It also can be seen from the figures that the impact force of the base-isolated structure can be minimized to a certain range of the yielding displacement.
4.3.3. Effect of gap size
In this section, the gap size effect is also investigated with the aforementioned five-story base-isolated structure excited by the above four different near-fault earthquakes with the gap size from 10 cm to 50 cm. The peak responses of the five-story base-isolated structure under the above near-fault earthquakes with a different seismic gap are shown in Fig. 9. From these figures, it can be seen that there is an initial increase in the peak floor acceleration. The peak inter-story drifts firstly increase at a certain gap distance. Then, it decreases with the gap distance for further increase. The peak impact force and peak base shear force have the same characteristics. When the maximum gap distance exceeds a certain size, there will be no pounding between adjacent structures. In this paper, the pounding can be avoided if the gap size is over 40 cm.
Fig. 8Yielding displacement versus peak responses of base-isolated structure with 10 cm gap
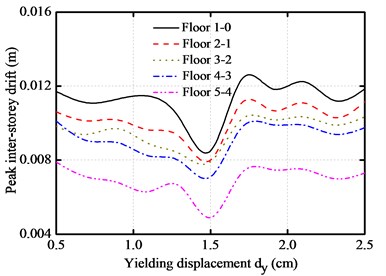
a) Peak inter-story drifts
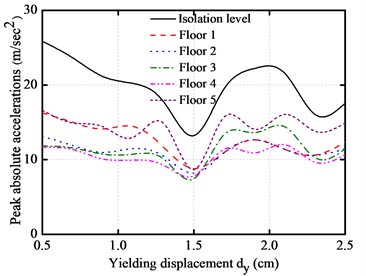
b) Peak absolute accelerations
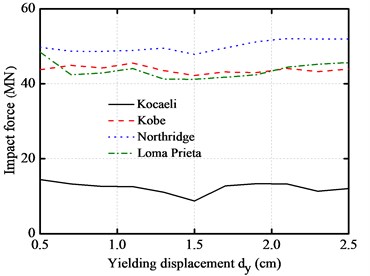
c) Peak impact forces
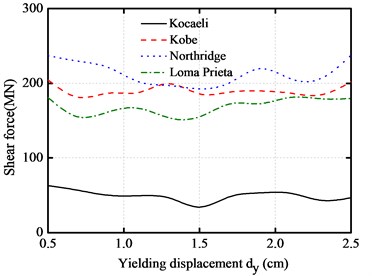
d) Maximum shear forces
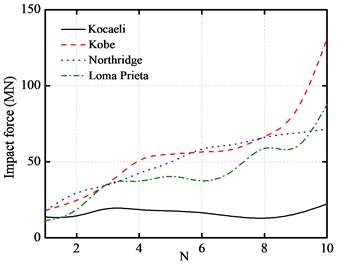
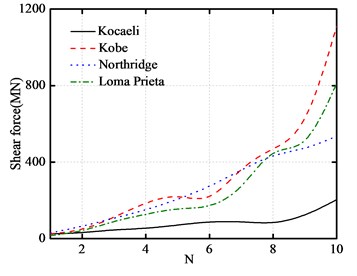
4.3.4. Effect of number of story
The variations of the peak top floor acceleration and the peak inter-story drift with the number of story are plotted in Fig. 10(a) and Fig. 10(b), respectively. The number of story varies from 1 to 10.
As shown from these figures, the peak top floor acceleration of base-isolated structure increases significantly with the increase of the number of story. On the other hand, as the number of story increases, the peak inter-story drift of the first floor also increases. Furthermore, the peak impact force and the peak base shear force increase with the increase of the story number.
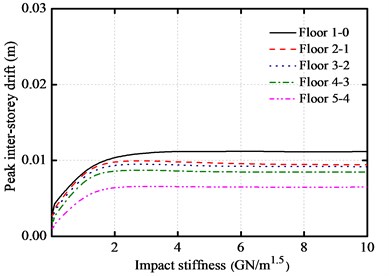
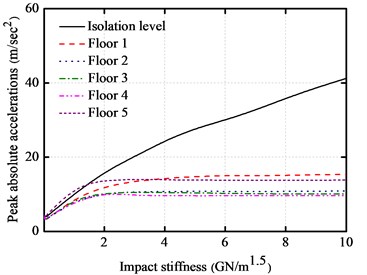
4.3.5. Effect of impact stiffness
The variations on the peak responses of the base-isolated structure with impact stiffness are shown in Fig. 11(a)-Fig. 11(d), respectively. Here, the gap size is equal to 10 cm. The impact stiffness varies from 0.01 to 10 GN/m1.5.
It can be shown from the figures that the peak inter-story drifts increase with the increase of the impact stiffness in the initial phase. When the impact stiffness increases to a certain value, the displacement keeps a constant value. It also can be observed that the peak inter-story drifts are almost insensitive to the impact stiffness with a value greater than 2 GN/m1.5.
Fig. 9Gap size versus peak responses of base-isolated structure under various earthquakes
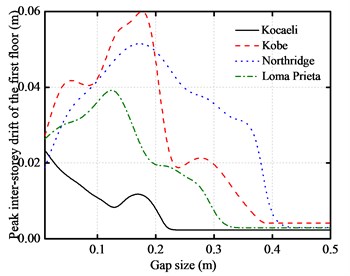
a) Peak inter-story drifts
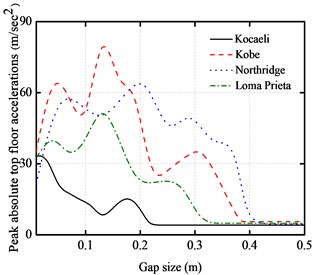
b) Peak absolute accelerations
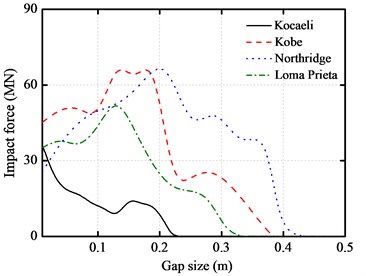
c) Peak impact forces
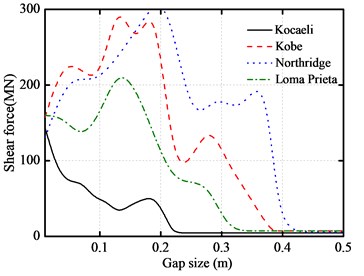
d) Maximum shear forces
Fig. 10Number of story versus peak responses of base-isolated structure with 10 cm gap
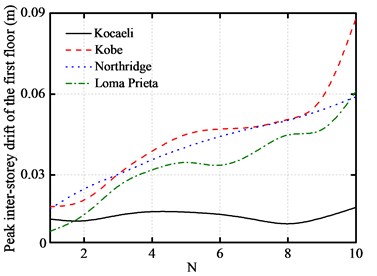
a) Peak inter-story drifts
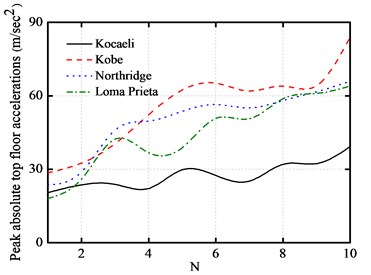
b) Peak absolute accelerations
c) Peak impact forces
d) Maximum shear forces
Fig. 11Impact stiffness versus peak responses of base-isolated structure with 10 cm gap
a) Peak inter-story drifts
b) Peak absolute accelerations
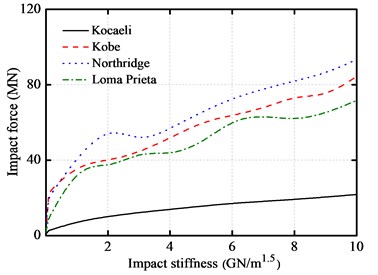
c) Peak impact forces
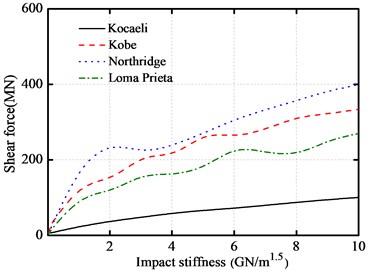
d) Maximum shear forces
However, the peak absolute floor acceleration at the isolation layer increases fleetly compared with the superstructure acceleration. The peak impact force and peak base shear force both increase with the increase of impact stiffness. Consequently, the floor accelerations increase obviously with the increase of the impact stiffness. It is very necessary to do a further research on the effects of these impact mitigation measures on the response of a base-isolated structure.
5. Conclusions
This paper firstly reviews the existing impact analysis models, and proposes a modified Hertz-damp model. The damping constant of the proposed model is theoretically derived and verified by numerical simulations. Numerical simulation of the existing pounding tests is conducted by MATLAB/Simulink software. A series of parameters for an analysis, including the isolation period, initial gap size and type of earthquake, yielding displacement, number of story, and impact stiffness are also implemented to investigate the effectiveness with a base-isolated structure under near-fault earthquakes. From the simulation results, several conclusions are summarized as follows:
1) The modified Hertz-damp model overcomes some shortcomings of the existing impact models. The merit of the model is that it has a higher accuracy in the pounding simulation, which can promote more accurate simulation of the structural impact responses. Comparing with a base-isolated building without impact and a fixed-supported structure, the floor accelerations and inter-story drifts of base-isolated structure increase at the top floor. When collision occurs, the accelerations of the base floor increase in evidence. The influence of pounding for the lower floors is more obvious than that for the upper structure.
2) The peak inter-story drift and peak acceleration of the base-isolated structure are not sensitive to an increase of the isolation period of isolation system. The peak impact force and peak base shear of the base-isolated structure slightly decrease with the increase of the isolation period. For various yielding displacements, all of the peak parameters of the base-isolated structure firstly reduce and then increase, and there is a minimum value. The peak inter-story drifts firstly increase at a certain gap distance. The peak impact force and the peak base shear force are the same discipline. When the maximum gap distance exceeds a certain size, there will be no pounding between adjacent structures.
3) The peak top floor acceleration of base-isolated structure increases significantly with the increase of the number of story. As the number of story increases, the peak inter-story drift of the first floor also increases. Furthermore, peak impact force and the peak base shear force increase with the increase of the story number. More importantly, the responds of the peak inter-story drift and peak superstructure acceleration increase with impact stiffness up to a maximum value, and then remain constant with the increase of impact stiffness, and the peak impact force and the peak base shear force increase with the increase of impact stiffness.
References
-
Ye Kun, Li Li, Zhu Hongping A modified Kelvin model for pounding simulation of base-isolated structures with adjacent structures under near-fault ground motions. Earthquake Engineering and Engineering Vibration, Vol. 8, Issue 3, 2009, p. 433-446.
-
Jankowski R. Non-linear viscoelastic modeling of earthquake-induced structural pounding. Earthquake Engineering and Structural Dynamics, Vol. 34, Issue 6, 2005, p. 595-611.
-
Muthukumar S., Desroches R. A Hertz contact model with non-linear damping for pounding simulation. Earthquake Engineering and Structural Dynamics, Vol. 11, Issue 7, 2006, p. 811-828.
-
Naeim F., Lew M., Huang S. C., Lam H. K. The performance of tall buildings during the 21 September 1999 Chi-Chi earthquake, Taiwan. The Structure Design of Tall Buildings, Vol. 9, Issue 2, 2000, p. 137-160.
-
Wang Zifa A preliminary report on the Great Wenchuan earthquake. Earthquake Engineering and Engineering Vibration, Vol. 7, Issue 2, 2008, p. 225-234.
-
Satish Nagarajaiah Xiaohong Sun Base-isolated FCC building impact response in Northridge earthquake. Journal of Structural Engineering, Vol. 127, Issue 9, 2001, p. 1063-1075.
-
Matsagar V. A., Jangid R. S. Seismic response of base-isolated structures during impact with adjacent structures. Engineering Structures, Vol. 25, Issue 12, 2003, p. 1311-1323.
-
Polycarpou P. C., Komodromos P. Earthquake-induced poundings of a seismically isolated building with adjacent structures. Engineering Structures, Vol. 32, 2010, p. 1937-1951.
-
Panayiotis C. P., Petros K. On poundings of a seismically isolated building with adjacent structures during strong earthquakes. Earthquake Engineering Structural dynamics, Vol. 39, 2010, p. 933-940.
-
Zhao Jianwei, Zou Lihua, Fang Leiqing Seismic response analysis of base-isolated structures considering pounding of adjacent building. Journal of Vibration and Shock, Vol. 29, Issue 5, 2010, p. 215-219.
-
Huang Xiao, Zhu Hongping Study on impact of adjacent base-isolated structures under near-fault earthquake. Journal of Civil Engineering and Management, Vol. 28, Issue 3, 2011, p. 249-253.
-
Zou Lihua, Guo Run, Huang Kai, Xu Zhixu Pounding of adjacent isolated-structures with prestressed rubber bearings. Journal of Vibration and Shock, Vol. 33, Issue 9, 2014, p. 131-136.
-
Maison B. F., Kasai K. Analysis for a type of structural pounding. Journal of Structural Engineering, Vol. 116, Issue 4, 1990, p. 957-977.
-
Anagnostopoulos S. A. Equivalent viscous damping for modeling inelastic impacts in earthquake pounding problems. Earthquake Engineering and Structural Dynamics, Vol. 33, Issue 8, 2004, p. 897-902.
-
Chau K. T., Wei X. X. Pounding of structures modeled as non-linear impacts of two oscillators. Earthquake Engineering and Structural Dynamics, Vol. 30, Issue 5, 2001, p. 633-651.
-
Hunt K. H., Crossley F. R. E. Coefficient of restitution interpreted as damping in vibroimpact. Journal of Applied Mechanics, Vol. 42, Issue 2, 1975, p. 440-445.
-
Jankowski R. Analytical expression between the impact damping ratio and the coefficient of restitution in the non-linear viscoelastic model of structural pounding. Earthquake Engineering and Structural Dynamics, Vol. 35, Issue 4, 2006, p. 517-524.
-
Ye Kun, Li Li, Zhu Hong Ping A note on the Hertz contact model with nonlinear damping for pounding simulation. Earthquake Engineering and Structural Dynamics, Vol. 38, 2009, p. 1135-1142.
-
Liu Peng, Zheng Kai Feng, He Wei, Liu Hu Improve algorithm of contact element model for earthquake-induced pounding between structures. Journal of Chongqing University, Vol. 35, 2012, p. 135-142.
-
Edwards C. H., Penney D. E. Calculus and Analytic Geometry. 1st edition, Prentice-Hall, Englewood Cliffs, NJ, 1982.
-
Xu Xiang, Liu Weiqing, Xu Xiuli Linear viscoelastic model of earthquake-induced structural pounding. Engineering Mechanics, Vol. 30, Issue 2, 2013, p. 278-284.
-
Petros Komodromos, Panayiotis Polycarpou C., Loizos Papaloizou, Marios C. Phocas Response of seismically isolated buildings considering poundings. Earthquake Engineering and Structural Dynamics, Vol. 36, Issue. 12, 2007, p. 1605-1622.
-
Mohammed Ismail Inner pounding control of the RNC isolator and its impact on seismic isolation efficiency under near-fault earthquakes. Engineering Structures, Vol. 86, 2015, p. 99-121.
About this article

This research was supported by the National Natural Science Foundation of China under Grant No. 51308487, No. 41402261 and No. 51408526, and Heibei Provincial Natural Science Foundation of China under Grant No. E2014203055. These supports for this research are greatly appreciated.
