Abstract
The high strength concrete shear walls are characterized by its high bearing capacity, high stiffness but a poor deformation capacity. In order to improve the deformation capacity of these members, specimens of high-strength concrete shear wall with steel tube confined boundary elements were designed and the quasi-static tests were conducted. The failure mode, failure mechanism, deformation capacity, hysteretic behavior, stiffness degradation and energy dissipation capacity of specimens were researched. The results indicate that the steel tube boundary elements can provide an effective confinement to the wall pier and the horizontal bearing capacity of specimens dropped slowly. Under a high axial force, the vertical bearing capacity of specimens can be maintained, and the deformation and energy dissipation capacity could be obviously enhanced due to the use of steel tubes in the boundary elements. The ultimate displacement and the energy dissipation of steel tube confined high-strength concrete shear walls were increased by 27 % and 81 % respectively compared to high-strength concrete shear walls with the same axial load ratio. According to the experimental results, the calculation formula is addressed for the cross-section bearing capacity of steel tube confined high-strength concrete shear wall. As a result, it is a good practice that the steel tube confined boundary elements can be utilized at the bottom strengthening zone so as to improve the seismic performance of high-strength concrete shear walls.
1. Introduction
High-strength concrete (HSC) is characterized by high strength, high durability, high anti-permeability, etc. In recent years, HSC over the strength grade of C50 has been widely applied to the lower stories of high-rise buildings and super tall buildings, so as to form the HSC beam, column, shear wall and other load bearing members [1, 2]. From the experimental results [3-5] in the domestic and foreign literatures, although HSC shear walls possess such advantages as high capacity, durability, etc., their ductility is not so sufficient, which limits their application in the high-rise buildings at the seismic zone. In order to improve their deformation capacity of such members, recently quite a few scholars launched a research and application on new-type steel reinforced concrete (SRC) composite shear walls. In 2004, the reinforcement and channel steel were respectively placed at the boundary confined region of shear wall sections, which were experimentally investigated; the results showed that compared to RC shear walls, SRC shear walls can effectively avoid the discontinuity out of plane, and the displacement ductility ratio is usually not less than 3 [6]. In 1998, the research on the flexural behavior of SRC shear walls with a shear span ratio of 2 was performed; the results indicated that the failure modes of SRC shear walls could be divided into two kinds: shear slip failure post-yielding steel and shear compression failure post-buckling steel [7]. In 2006, the repeated horizontal loading tests were conducted on 16 pieces of SRC shear walls; studied the influences of shear span ratio, axial load ratio, percentage of steel, and position of steel on the seismic performance of SRC shear walls [8]. In 2007, Liang et al. [9] performed pseudo static tests on the HSC shear wall with piece wisely confined stirrup, and primarily studied the energy dissipating capacity, and deformation capacity. In 2009, Liao et al. [10] investigated the seismic behavior of circular CFST columns and RC shear wall mixed structures to constant axial load and cyclic lateral load. The strength, ductility, rigidity and dissipated energy of the specimens were analyzed. In 2008 and 2010, Qian et al. [11, 12] carried out a repeated horizontal loading tests on the RC shear wall, SRC shear wall, and steel tube shear wall with high axial load ratios; the research results showed that the placement of the circular steel tube played a significant role in improving the deformation capacity of shear walls. In 2012, Karamlou et al. [13] analyzed the experimental results of four L-shaped reinforced concrete shear walls. The results were analyzed in terms of stiffness, strength, and cracking patterns. In 2012, Guan et al. [14] analyzed the ultimate strength normal and high strength concrete wall panels with varying opening configurations. In 2013, Nie et al. [15] studied the seismic behavior of high-strength concrete filled double-steel-plate composite walls under the large axial compressive force and reversed cyclic lateral load, and analyzed the stiffness, strength degradations, and deformation characteristics. In 2013, Quiroz et al. [16] studied the cyclic behavior of thin RC Peruvian shear walls through full-scale experimental investigation and numerical simulation.
However, until now the strength grades of concrete employed in domestic and foreign experiments of composite shear walls are nearly lower than C50, but the research on the HSC composite shear wall is seldom seen. In this study, the steel tube is placed in the boundary elements of HSC shear walls to form a steel tube confined HSC shear wall. The core concrete is tri-axial confined states due to the steel tube, thus which can effectively improve the brittleness of HSC, and enhance the ductility and energy dissipation capacity of members.
In order to investigate the seismic performance of steel tube confined HSC shear walls, three shear wall specimens were tested under the high axial compressive forces and low-cycle reversed horizontal loads.
2. Experimental
2.1. Design and fabrication of specimens
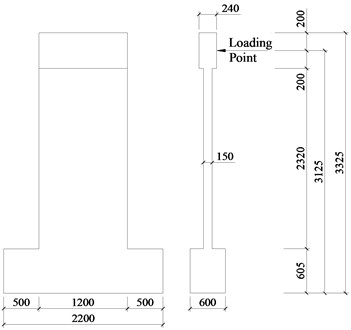
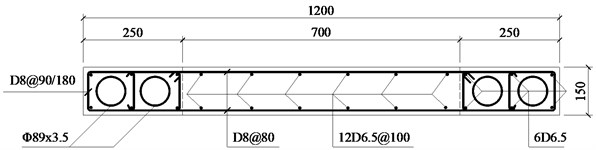
The specimens were assigned numbers, HW-1, STHW-2 and STHW-3, and the shear span ratio of specimens was equally 2.1. The sectional size of shear walls was 1200 mm×150 mm. The specimen HW-1 was an ordinary RC shear wall specimen, and the other two were steel tube confined HSC shear wall specimens. The axial forces for three specimens were respectively 1400 kN, 1400 kN and 1700 kN. The RC loading beams were mounted at the top of shear walls; steel plates were pre-buried at both ends of loading beams; a foundation beam was also set at the base of the wall, which is integrally poured with shear walls. The elevation view of the shear wall is shown in Fig. 1.
Fig. 1Elevation view of specimen
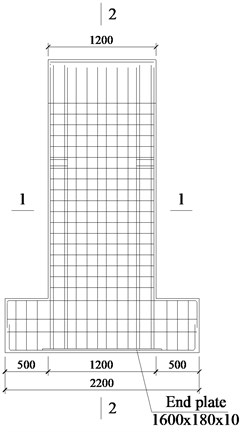
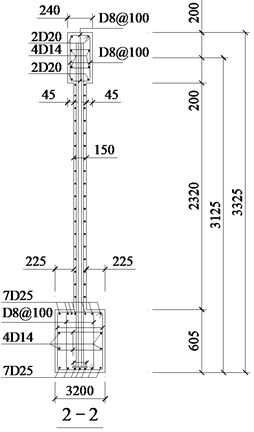
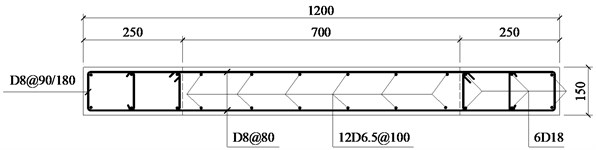
The dimensions and reinforcing details of specimens are shown in Fig. 2. The regions within 0.2 at either extreme fiber of shear wall sections were designated as confined boundary elements ( is the height of the wall section). The confined boundary elements of HW-1 were reinforced by 6D18 longitudinal reinforcements, and the area of reinforcements was 1527 mm2. The confined boundary elements of STHW-2 and STHW-3 were reinforced by 2Φ89×3.5, and the area of the steel tube was 1880 mm2. The stirrups were selected as D8@90 for the confined region of specimens, and the characteristic value of the stirrup is 0.21. The vertical distribution reinforcement is D6.5@100. The above specimens designed all meet the criterion of strong shear and weak flexure. The horizontal distribution reinforcement is D8@80. The photos of steel tubes and reinforcement skeletons for specimens are shown in Fig. 3.
Fig. 2Dimensions and reinforcing details of specimen
a) Front elevation
b) Side elevation
c) 1-1 (HW-1)
d) 1-1 (STHW-2)

e) 1-1 (STHW-3)
2.2. Mechanical properties of materials
The strength grade of C65 was pre-selected for specimens. When concreted mixed, the silicon, and other additives were added, (the mix ratio-cement: fly ash: mineral powder: crushed stone: sand: water reducer: water = 1.0: 0.11: 0.2: 2.5: 1.53: 0.02: 0.366, and the water gel ratio was 0.28), which enables the concrete to be of high strength, high durability, and high anti-permeability. When concrete poured for specimens, the standard cubic specimens with a side length of 150 mm were fabricated; these cubic specimens were cured at the same conditions as shear wall specimens. On the testing day, the averages of the compressive strength for cubes were respectively measured as 68.5 MPa, 71.9 MPa, 75.4 MPa. In order to facilitate concrete placement, the concrete in the steel tubes was placed one week ahead of shear walls, whose average compressive strength of cubes was 70.0 MPa. The Q235B steel was used for the steel tube, HPB235 was adopted for D6.5, and HRB400 for D8 and D18. The measured values of strength for steel tubes and reinforcements are shown in Table 1.
Fig. 3Photo of steel tube skeleton in specimen
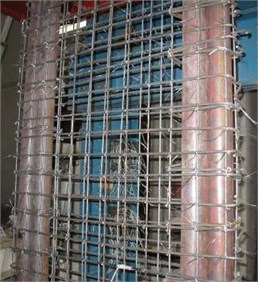
Table 1Measured values of strength for steel tubes and reinforcements
Steel tube or reinforcement | Yield strength / MPa | Ultimate strength / MPa |
Φ89×3.5 | 388.0 | 500.2 |
D6.5 | 390.69 | 522.08 |
D8 | 508.98 | 656.53 |
D18 | 476.3 | 648.9 |
2.3. Experimental setup and measuring parameters
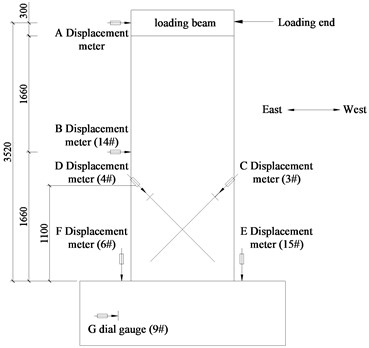
The low cycle reversal horizontal loading was employed during the tests. The experimental setup is shown as Fig. 4. At the beginning of testing, the vertical load was firstly applied by the hydraulic jack, and during the test the vertical load was maintained a constant by a balance device. Then the reversal horizontal loads were applied by the displacement controlled loading. Before yielding, each level of displacement cycle was loaded once, but loaded three times after yielding. The measuring contents include: hysteresis curves of load and displacement for specimens, strains of reinforcement and steel tube, cracks of shear wall etc. The arrangement of displacement meters are shown in Fig. 5.
3. Failure process and failure mechanism analysis of specimens
3.1. Failure process of specimens
3.1.1. Specimen HW-1
The axial compressive force of HW-1 was 1400 kN, and the controlled axial load ratio was 0.16. The whole test was loaded by the displacement controlled loading. At the first loading phase, the displacement step was 2 mm, and a single cyclic loading was performed. When loaded to the positive 8 mm, the first fine horizontal crack occurred at the distance of 150 mm from the bottom of the tensile side, and meanwhile the horizontal force was 374 kN. When loaded to the negative 8 mm, several fine horizontal cracks appeared at the corresponding location of another side. With increasing the loads, new cracks continuously occurred at the upper of wall pier. When loaded to the positive 10 mm, the horizontal cracks developed at the inclined direction, the concrete of confined region cracked at the base of the wall pier, and the vertical cracks took shape. When loaded to the positive 20 mm, it could be observed that the load-displacement curve deviated from the straight line, and at this time each level of displacement increment was modified to 6 mm for three cycles.
Fig. 4Experimental setup
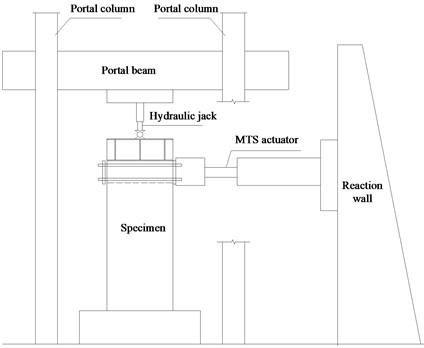
Fig. 5Arrangement of displacement meters
When loaded to the positive 26 mm, some horizontal cracks began to extend and widen, the cover concrete spalled down at the bottom confined region, and the specimens simultaneously attained the peak loads. When loaded to the positive 38 mm, the cover concrete totally spalled down at the confined region and the stirrup was exposed. When loaded to the positive 44 mm, a large area of concrete at the confined region was crushed, bulged, and spalled outwards. When continuing loading, under the concurrent action of moment and vertical compressive force, the longitudinal reinforcement was compressed to yielding, the concrete of confined region was disintegrated at the bottom, and the load bearing capacity decreased and the specimen failed suddenly. The eventual failure modes and crack distributions are shown in Fig. 6(a).
3.1.2. Specimen STHW-2
The axial compressive force of STHW-2 was 1400 kN and the controlled axial load ratio was 0.16. When loaded to the positive 10 mm, the first fine horizontal crack occurred at the location of 100 mm from the bottom of the tensile side and the horizontal force was 405 kN. With the increase of loads, new horizontal cracks constantly appeared at the base of the wall. When loaded to the positive 12 mm, the horizontal cracks at the middle of wall pier developed at the inclined direction, and the vertical cracks began to take shape at the bottom of the compressive zone. When loaded to the positive 16 mm, the cracks at the bottom of the wall pier increased, and each level of displacement increment was modified to 6 mm for three cycles.
When loaded to the positive 22 mm, some inclined cracks at the middle of wall pier began to extend and widen, and the cover concrete spalled down at the compressive zone of the wall pier bottom. When loaded to the positive 48 mm, the concrete at the confined region bulged, spalled outwards and the steel tube was exposed. When continuing loading to the positive 60 mm, the failure range of concrete at the wall pier bottom entered the unconfined region, and a large area of concrete cracks. When continuing loading, the vertical distribution reinforcement was subjected to a compressive yield, the concrete at the unconfined region spalled down due to extrusion, the steel tube slightly bulged out. Owing to the confinement of steel tube, the horizontal capacity descends slowly, the disintegration does not occur to the specimen. When loaded to 70 % of the peak load, the test is ended.
3.1.3. Specimen STHW-3
The axial compressive force of STHW-3 was 1700 kN, the controlled axial load ratio was 0.19, and the other parameters were the same as STHW-02. When loaded to the positive 10 mm, the first fine horizontal crack occurred at the location of 50 mm from the bottom of tensile side and the horizontal force was 462 kN. With the increase of loads, new horizontal cracks constantly appeared at the base of the wall pier. When loaded to the positive 16 mm, the cover concrete spalled down at the confined region, and at this time each level of displacement was modified to 6 mm for three cycles.
When loaded to the positive 22 mm, some horizontal cracks at the wall pier base began to widen and extend at the inclined direction. When loaded to the positive 40 mm, the cover concrete spalled down at the confined region and the steel tube was exposed. When loaded to the positive 54 mm, the crushed compressive region entered the non-confined region. Continuing loading, the vertical distribution reinforcement was compressively yielded, a large area of unconfined concrete was crushed, spalled, and steel tubes bulged. Owing to the action of steel tube, the specimen was not disintegrated subject to the large vertical compression, and maintained the vertical capacity. When the horizontal load reached less than 70 % of the peak load, the test was terminated. The final failure modes and crack distributions are shown in Fig. 6(c).
Fig. 6Damage modes and crack distribution of specimens
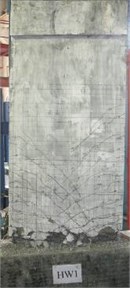
a) HW-1
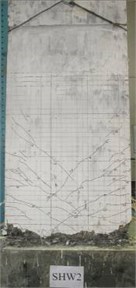
b) STHW-2
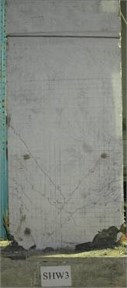
c) STHW-3
3.2. Analysis of failure mechanism
According to the above failure modes of specimens, under the concurrent action of the bending moment and vertical compressive force, both the longitudinal reinforcement and steel tube at the end of specimens yield, and quite a few inclined cracks appear at the middle of wall piers. The concrete at the compressive zone of the specimen bottom loosens and spalls, and the flexural failure occurs to the specimen. For the specimen HW-1 with an ordinary reinforcing configuration, the concrete at the confined region of the wall bottom is crushed, and almost totally spalls, as shown in Fig. 7(a). At the later period of loading, the specimen totally loses the vertical capacity, and experiences a sudden disintegration failure. For the specimens STHW-2 and STHW-3 with steel tube confined boundary members, the ultimate compressive strain of concrete at the compressive zone is increased due to the tri-axial confinement to core concrete induced by steel tubes; the horizontal bearing capacity of specimens only slowly decreases; the specimens do not undergo the disintegration under the action of a large vertical compressive force (Fig. 7(b)) and thus still keep a vertical bearing capacity. Compared to STHW-3, the specimen STHW-2 with a lower axial load ratio has more cracks, the cracking directions are not so steep as that of STHW-3, and the cracks are fully propagated, which accounts for a good ductility of STHW-2.
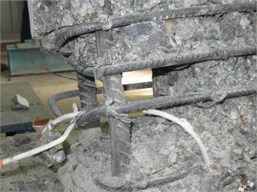
From the failure modes of core concrete with the steel tube eliminated after tests, the concrete confined by the steel tube at the bottom of the specimen is nearly complete, as shown in Fig. 7(c).
Fig. 7Comparison of failure modes between stirrup and tube confined boundary elements
a) Failure mode of specimen with ordinary stirrup confined boundary elements
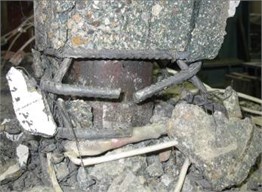
b) Failure mode of specimen with steel tube confined boundary elements
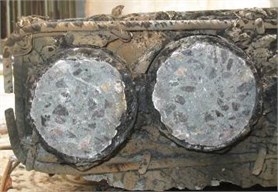
c) Complete core concrete confined by steel tubes
Fig. 8Top lateral force-displacement hysteresis curves of specimens
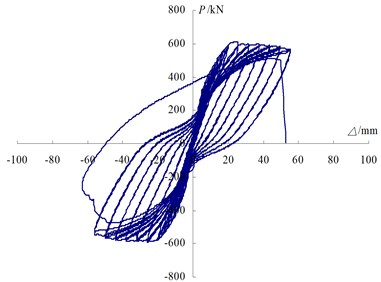
a) HW-1
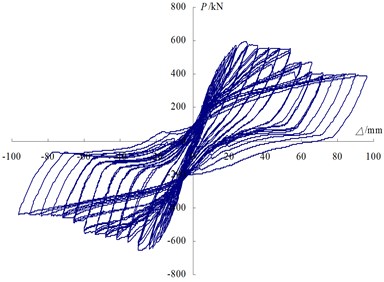
b) STHW-2
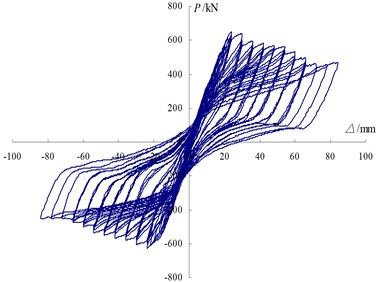
c) STHW-3
4. Behavior analyses of specimens
4.1. Load-displacement hysteresis characteristics
The hysteresis curves between the horizontal force and horizontal displacement at the top of specimens are shown in Fig. 8. The specimens HW-1 and STHW-2 have the same axial load ratio. From the shapes of hysteresis curves, the stability of hysteresis curves decreases for HW-1 beyond the peak capacity, and the specimen HW-1 undergoes a sudden disintegration failure. The hysteresis curves of STHW-2 are more plump than those of HW-1; beyond the peak capacity, the hysteresis curves exhibit a desirable stability, which enables the specimen STHW-2 to suffer more loading cycles. The axial load ratio of STHW-3 is greater than that of HW-1, but above the peak capacity, the specimen STHW-3 can still support loads with increasing the loading displacement. It indicates that: when the steel tube is placed in the boundary elements of shear walls, the hysteresis characteristics can be improved for the HSC shear wall, and the unfavorable effect of brittle failure on the deformation capacity of shear wall can be overcome as well. Likewise, the hysteretic curves of the specimen STHW-2 with a lower axial load ratio are plumper than those of STHW-3, and STHW-2 has a larger ultimate displacement.
4.2. Skeleton curves
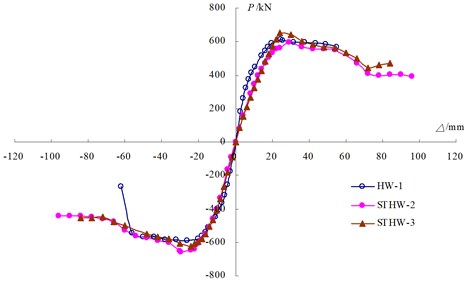
According to the hysteresis curves involving the horizontal force and displacement at the top of specimens, the skeleton curves are plotted as shown in Fig. 9.
From Fig. 9, the ultimate displacements of STHW-2 and STHW-3 are larger than that of HW-1, and these two specimens display a better deformation capacity at the later loading phase. The axial load ratio has a certain influence on the skeleton curves of specimens. The axial load ratio of STHW-3 is larger than that of STHW-2, and however, the peak load of the former increases slightly, and the descending branch is steeper.
Fig. 9Skeleton curves of specimens
4.3. Analysis of deformation capacity
In this study, the cracking load is determined when the fine cracks occur to the sections at the bottom of specimen. The energy equivalent method is utilized to determine the yield point of specimens, the nominal ultimate load is taken as 85 % of peak load at the descending branch, and the corresponding displacement is the ultimate displacement , the displacement ductility coefficient can be obtained by the ratio of ultimate displacement to the yield displacement . The ultimate drift ratio is an important index indicative of the deformation capacity and the tested value is the ratio of ultimate displacement to the height of loading points. The loads, displacements, and displacement ductility coefficients at the characteristic points of each specimen are shown in Table 2.
From Table 2, the cracking loads will increase for the higher axial load ratios. The ultimate displacement and displacement ductility coefficient both increase when the boundary members of specimens are reinforced by steel tubes. For the same axial load ratios, the ultimate displacement of STHW-2 is 27 % greater than that of HW-1, and the displacement ductility coefficient of STHW-2 is 22 % greater than that of HW-1. Although the axial load ratio of STHW-3 is greater than that of HW-1, the former has a greater limit displacement and displacement ductility coefficient than the latter. For the specimens equally reinforced by the same steel tubes, the ultimate displacement of STHW-2 with a lower axial load ratio is 15 % greater than that of STHW-3, and the displacement ductility coefficient of STHW-2 is 17 % greater than that of STHW-3.
The analysis results indicate that the use of steel tube confinement can improve the deformation capacity of the HSC shear wall, and improve the feature of the HSC shear wall prone to brittle fracture.
Table 2Characteristic points and ductility coefficients of specimens
Specimen | Cracking load | Yield load | Yield displacement | Peak load | Calculation value of peak load | Corresponding displacement | Ultimate load | Ultimate displacement | Ductility Coefficient | Ultimate drift ratio | |
(kN) | (kN) | (mm) | (kN) | (kN) | (mm) | 0.85 (kN) | (mm) | ||||
HW-1 | Push | 374 | 478.4 | 12.3 | 611.0 | 24.8 | 550.0 | 48.1 | 3.9 | 1/52 | |
Pull | – | 489.0 | 13.3 | 591.8 | 25.9 | 503.7 | 50.4 | 3.7 | 1/50 | ||
STHW-2 | Push | 405 | 418.8 | 13.1 | 594.7 | 613.6 | 29.1 | 505.5 | 60.4 | 4.6 | 1/42 |
Pull | – | 506.9 | 13.8 | 655.6 | 29.5 | 557.2 | 64.6 | 4.7 | 1/39 | ||
STHW-3 | Push | 462 | 424.4 | 14.0 | 651.8 | 620.0 | 24.1 | 554.0 | 56.3 | 4.0 | 1/45 |
Pull | – | 495.3 | 13.5 | 626.3 | 24.0 | 532.3 | 52.0 | 3.9 | 1/48 | ||
4.4. Strain analysis of steel tube and reinforcement
4.4.1. Distribution of longitudinal strain along the section for steel tube and reinforcement
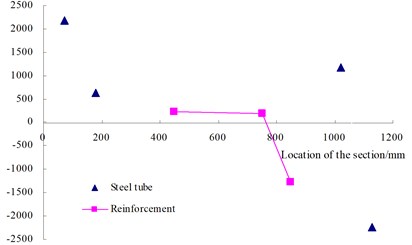
The longitudinal strains are extracted for steel tubes, vertical reinforcements at different locations of the root section of the specimen STHW-2. The strain distributions at the applied axial force, yield point, peak point are plotted as Fig. 10; the strain distributions at the sections of other specimens are similar as seen in Fig. 10.
It can be seen from Fig. 10 that when applying the axial force and keeping the load for a period, the full section of the specimen is in compression and the end strain is relatively large. When reaching the yielding state, the strain distribution of specimen fundamentally follows the plane section hypothesis. When reaching the peak capacity, the steel tubes at the tensile and compressive ends of specimens are subjected to yield, and the steel tube should resist the vertical loads and horizontal loads. The sectional strain approximately obeys the hypothesis of plane section.
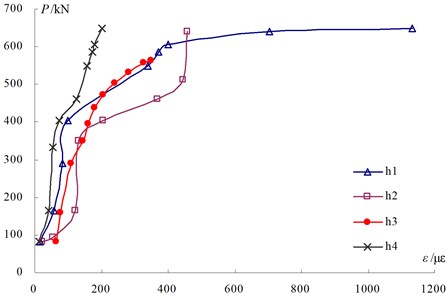
4.4.2. Analysis of circumferential strain for steel tube
The circumferential strains - at different heights of cross sections from the most outer steel tube are extracted for STHW-2, as shown in Fig. 11. represents the circumferential strain of the root section of steel tubes. According to the relationships between the load and circumferential strain of the steel tube, with the increase in the horizontal load, the circumferential strain is gradually increasing, that is, the confined stress applied to the core concrete due to steel tube is gradually increasing as well. When attaining the peak load, the circumferential strain at the root section can attain 1200 με, which enhances the deformation capacity of the core HSC, and thus the ductility of specimen is improved. Through comparison, the circumferential strain at the root section is relatively large, which indicates that the confined stress at the root section is larger than that of other locations, and the confined action of steel tubes is fully made use of.
Fig. 10Longitudinal strain distributions of steel tubes and vertical reinforcements the root section of STHW-2
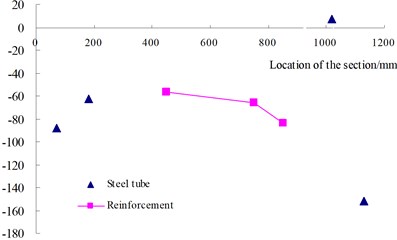
a) Applied axial force
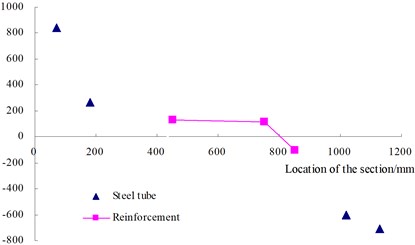
b) Yield point
c) Peak point
Fig. 11Lateral force-circumferential strain distribution of steel tubes of STHW-2
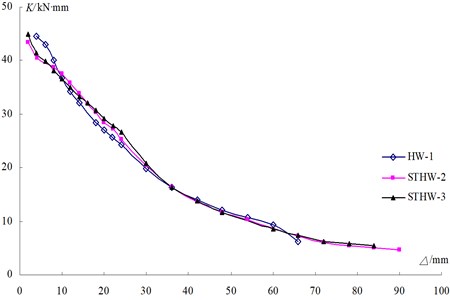
4.5. Analysis of stiffness degradation
The secant stiffness is used as the stiffness degradation characteristics of shear wall under low-cycle reversed loads. Fig. 12 denotes the measuring curve of stiffness versus top displacement. It can be seen that the stiffness attenuates with increasing the top displacement.
The above results indicate that the initial stiffness is approximate to that at the later phase of loading. The specimens STHW-2 and STHW-3 confined by the steel tube exhibit a slow stiffness degradation, the confined boundary element reinforced by the steel tube can improve the later capacity of HSC shear wall with a high axial load ratio.
4.6. Energy dissipation capacity
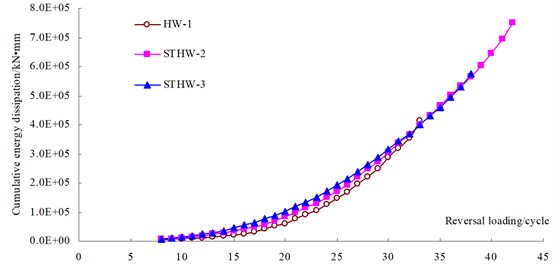
The area enclosed by the curve of load and displacement can reflect the energy dissipated by structures. The accumulation of energy dissipated at each cycle can be referred to as the total cumulative energy of the specimens. The curves of total cumulative energy, cumulative energy versus loading cycles are shown in Fig. 13 and Table 3.
Fig. 12Stiffness degradation curves
It can be shown that the specimens STHW-2 and STHW-3 can experience more loading cycles, can dissipate more energy at each level of cycle load than HW-1; For the same axial load ratio, the energy dissipated by the specimen STHW-2 is 81 % more than that dissipated by HW-1, which demonstrates that the placement of steel tubes at both edges of specimens can effectively confine the wall pier, and can enhance the energy dissipating capacity. The axial load ratio of STHW-3 is larger than that of HW-1, but the energy dissipated by the former is 38 % higher than that by HW-1. It is illustrated that the adoption of steel tube confinement can improve the bound of axial load ratio for HSC shear wall, and can improve the energy dissipation of HSC shear wall at a high axial load ratio. When the other parameters are the same, STHW-2 can experience more loading cycles than STHW-3, and thus the energy dissipated by STHW-2 is 31 % higher than that by STHW-3, which indicates that the energy dissipation capacity of shear wall specimens will decrease with the increase of the axial load ratio.
Table 3Energy dissipations of specimens
Specimen number | HW-1 | STHW-2 | STHW-3 |
Total energy dissipation / kN·mm | 414287.3 | 751947.3 | 574593.4 |
Fig. 13Cumulative energy dissipation versus loading cycle curves
5. Calculation for the bearing capacity of the cross section
Under the combined action of the axial load and bending moment, the calculation method for the cross-section bearing capacity of eccentrically loaded members can be utilized to analyze the bearing capacity of the steel tube confined high-strength concrete shear wall subjected to the flexural failure.
The experimental results indicate that the placement of steel tubes in the boundary elements can provide an effective confinement for the core concrete. Therefore, in computing the bearing capacity of the cross section for steel tube confined high-strength concrete shear wall, the confinement of steel tubes to the core concrete should be taken into consideration. The ultimate limit states of the cross section for steel tube confined high-strength concrete shear wall can be defined as: Both the steel tube and reinforcement at the tensile and compressive ends equally yield; the concrete at the compressive zone is crushed. The confined region should involve the consideration of the transverse confinement due to steel tubes, and the stress-strain curve of the steel tube confined concrete in document [12] is adopted. The stress distribution of the cross section for the specimen is shown in Fig. 14.
Fig. 14Calculation diagram of the cross section in the ultimate limit state
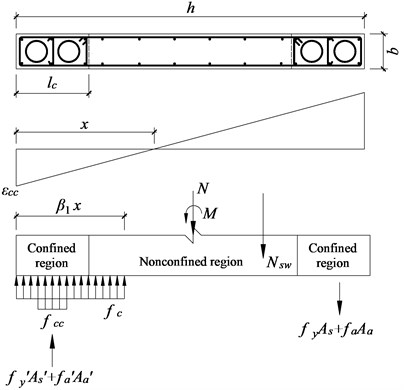
The steel tubes and reinforcement are symmetrically placed at the boundary elements. According to the equilibrium of axial forces for the cross section, we have:
where is the axial compressive strength of the core concrete confined by steel tubes, is the area of core concrete. Based on document [12]:
where is the hooping index of steel tube confined concrete, ; is the design value of strength for steel tube; is the area of steel tube, is the design value of axial compressive strength of concrete.
Substituting Eqs. (2)-(4) into Eq. (1), one obtains the depth of compressive concrete as follows:
The moment with respect to the resultant point of steel tube and reinforcement at the tensile zone can get:
The substitution of Eqs. (8)-(10) into Eq. (7) can get the cross-section bearing capacity of the steel tube confined high-strength concrete shear wall. Through conversion of the calculated moments sustained by STHW-2 and STHW-3, the obtained calculation values of horizontal bearing capacity are given in Table 2. From Table 2, in accordance with the calculation method for the cross-section bearing capacity of eccentrically loaded members, and simultaneously in considering the confinement of steel tubes to the both ends of wall pier, the proposed formula is demonstrated to be feasible for calculating the cross-section bearing capacity of steel tube confined high-strength concrete shear wall subject to flexural failure.
6. Conclusions
Through the low-cycle reversal loading tests and analysis for the steel confined HSC shear wall, the following conclusions can be drawn:
1) Under the concurrent action of the bending moment and vertical compressive force, the steel tube and the longitudinal reinforcement at both ends of specimen yields, the concrete at the compressive zone is crushed, and the specimen experiences a flexural failure. The HSC shear wall can be better confined by the steel tube, the horizontal capacity decreases slowly, and the concrete disintegration does not occur to the specimen at the higher vertical compressive forces and still maintains the vertical capacity.
2) The installment of steel tube in the confined border member of HSC shear wall can provide an effective confinement to the wall piers, can obviously improve the deformation and energy dissipation capacity; its limit displacement is 27 % larger than that of ordinarily reinforced shear wall, and the energy dissipation is 81 % higher than that of the latter.
3) On the basis of the calculation method for the cross-section bearing capacity in eccentrically loaded members, combined with the steel tube confinement to the either end of wall pier, the calculation formula is put forward for the cross sectional bearing capacity of steel tube confined high-strength concrete shear wall. The results obtained by the proposed formula are in a good agreement with the experimental results.
4) The steel tube confined HSC shear walls herein can improve the unfavorable brittleness of high strength concrete, can make full use of steel tubes, can simultaneously enhance the bearing capacity and ductility, thus to improve the seismic performance. The steel tube confined HSC shear walls can reduce the sectional sizes of shear walls and increase the utilization area, can be conveniently constructed, and can be cost-effective. In actual projects, the steel tube confined boundary elements can be set at the bottom reinforced region with a high axial load ratio in order to enhance the seismic performance of HSC shear walls. With the sustainable development of high-rise and super high-rise buildings at home and abroad, the steel tube confined HSC shear walls may enjoy wide application.
References
-
Ye L. P., Lu X. Z., Feng P., Qazi A. U., Wang X. L., Lin X. C. High strength/performance structural materials and the developments of modern engineering structures and the design theory. Proceedings of 1st International Forum on New Advances in Structural Engineering, 2006, p. 208-250.
-
Chen Z. Y. The development and application of high- strength and high-performance concrete. China Civil Engineering Journal, Vol. 30, Issue 5, 1997, p. 3-11, (in Chinese).
-
Liang X. W., Xin L., Deng M. K., Fang L., Zhang X. H. Experimental study on seismic behavior and performance indexes of high-strength concrete shear walls. China Civil Engineering Journal, Vol. 43, Issue 11, 2010, p. 37-45, (in Chinese).
-
Oh Y. H., Han S. W., Lee L. H. Effect of boundary element details on the seismic deformation capacity of structural walls. Earthquake Engineering and Structural Dynamics, Vol. 31, Issue 8, 2002, p. 1583-1602.
-
Emamy F. F., Stephen J. F. Strength and deformation of high- strength concrete shear walls. ACI Structural Journal, Vol. 105, Issue 1, 2008, p. 21-29.
-
Soon H. C., Bryce T., William D. C., Denis M. Structural steel boundary elements for ductile concrete walls. Journal of Structural Engineering, Vol. 130, Issue 5, 2004, p. 762-768.
-
Wang Z. H., Fang E. H., Qian J. R. Flexural behavior of steel reinforced concrete shear walls. Building Structure, Vol. 28, Issue 12, 1998, p. 13-21, (in Chinese).
-
Lv X. L., Dong Y. G., Ding Z. W. Study on seismic behavior of steel reinforced concrete wall. Earthquake Engineering and Engineering Vibration, Vol. 26, Issue 6, 2006, p. 101-107., (in Chinese).
-
Liang X. W., Deng M. K., Zhang X. H., Tian S. F. Experimental study on performance-based seismic design of high performance concrete shear wall. Journal of Building Structures, Vol. 28, Issue 5, 2007, p. 80-87, (in Chinese).
-
Liao F. Y., Han L. H., Tao Z. Seismic behavior of circular CFST columns and RC shear wall mixed structures: experiments. Journal of Constructional Steel Research, Vol. 65, Issues 8-9, 2009, p. 1582-1596.
-
Qian J. R., Wei Y. Experimental study on seismic behavior of SRC shear walls with high axial force ratio. Journal of Building Structures, Vol. 29, Issue 4, 2008, p. 43-50, (in Chinese).
-
Qian J. R., Jiang Z., Ji X. D. Experimental study on seismic behavior of steel tube-reinforced concrete composite shear walls with high axial compressive load ratio. Journal of Building Structures, Vol. 31, Issue 7, 2010, p. 40-48, (in Chinese).
-
Karamlou A., Kabir M. Z. Experimental study of L-shaped slender R-ICF shear walls under cyclic lateral loading. Engineering Structures, Vol. 36, 2012, p. 134-146.
-
Guan H., Cooper C., Lee D. J. Ultimate strength analysis of normal and high strength concrete wall panels with varying opening configurations. Engineering Structures, Vol. 32, 2010, p. 1341-1355.
-
Nie J. G., Hu H. S., Fan J. S., Tao M. X., Li S. Y., Liu F. J. Experimental study on seismic behavior of high-strength concrete filled double-steel-plate composite walls. Journal of Constructional Steel Research, Vol. 88, 2013, p. 206-219.
-
Quiroz L. G., Maruyama Y., Zavala C. Cyclic behavior of thin RC Peruvian shear walls: full-scale experimental investigation and numerical simulation. Engineering Structures, Vol. 52, 2013, p. 153-167.
Cited by
About this article

The author would like to acknowledge the financial support from the National Natural Science Foundation of China (Nos. 51108035, 51208058, 51178388 and 10972168), the China Postdoctoral Science Foundation funded project (Nos. 2011049165 and 2012T50790), the Natural Science Basic Research Plan in Shaanxi Province of China (No. 2013JM7030), and the Special Fund for Basic Scientific Research of Central College (Nos. 310828162017 and 310828161009).
